Digital data
The Geological Survey of Queensland (GSQ) makes available a wide range of geoscience data products.
Datasets are sourced from GSQ projects and from statutory reports lodged by exploration companies.
This guide describes the datasets available, including geophysical data, exploration geochemistry data, digital geological mapping data, mineral occurrence and geological observation data, wireline log data and hyperspectral image maps.
Accessing data
You can download most datasets free of charge from the GSQ Open Data Portal.
Digital mapping data can also be downloaded from QSpatial.
Geophysical data
The Geological Survey of Queensland (GSQ) is the custodian of geophysical data in Queensland and regularly collects regional geophysical data to aid exploration.
The primary types of data held by the GSQ include:
- 2D and 3D seismic data
- airborne geophysical data
- gravity data
- deep seismic reflection surveys
- magnetotellurics (MT) surveys.
2D and 3D seismic data
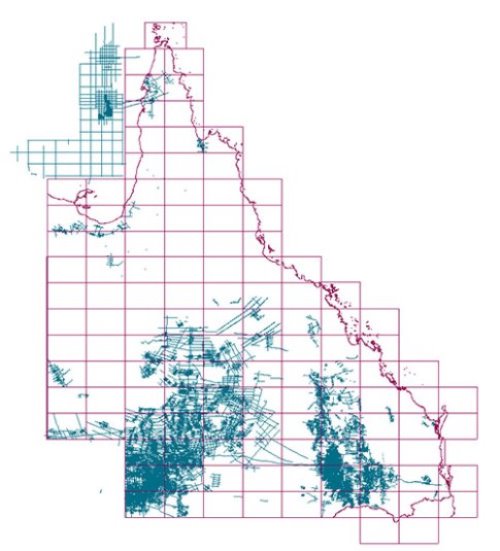
Under Queensland regulations, companies that carry out a seismic survey in Queensland are required to submit their field and processed data to the Queensland Government. The data becomes open file (publicly available) following a 3-year confidentiality period. This data is then added to our online seismic data catalogue for exploration companies to access using the GSQ Open Data Portal.
The data packages available online are ready to be loaded into industry software without requiring expensive or time consuming modifications. Most of the seismic data is preloaded into Kingdom projects.
To access open file seismic data, visit the GSQ Open Data Portal or contact GSQ (see details below).
The below image shows seismic coverage of Queensland.
Airborne surveys
Airborne geophysical data includes magnetic, radiometric, electromagnetic and gravity data.
GSQ conducts regional airborne surveys to provide publicly available precompetitive data to explorers to encourage exploration investment in Queensland. The data is also useful for some land use study applications. Queensland Government funded surveys usually involve collecting magnetic and radiometric data with 400m line spacing or better.
GSQ is also the custodian of data from similar small-scale surveys conducted by the exploration industry who are required by law to submit all airborne geophysical data to the Department of Natural Resources and Mines, Manufacturing and Regional and Rural Development within one year of acquiring the data. Once the data is made publicly available it can be obtained from the GSQ.
Information about data submission requirements and confidentiality periods for geophysical surveys can be found in the Mineral Resources Act 1989, the Petroleum and Gas (Production and Safety) Act 2004, the Geothermal Energy Act 2010 and the Greenhouse Gas Storage Act 2009.
The below image shows coverage of the 400m line spacing or better regional magnetic and radiometric geophysical data throughout Queensland.

Gravity surveys
GSQ conducts regional gravity surveys with a station spacing that is equal to or less than 4km. The collected data is then incorporated into the National Gravity Database. The image below shows coverage of gravity data and station spacing of surveys in Queensland.

Deep seismic reflection surveys
Deep seismic reflection surveys give a broader picture of the geological profile at depth as they are sensitive to different structural and petrophysical properties. The acquired data (in conjunction with rock properties and geophysical data) is enabling a much better understanding of the geology and mineral potential of northern Queensland.
In 2006 to 2007, GSQ and Geoscience Australia (GA) conducted deep crustal seismic surveys across the Mount Isa mineral province, eastwards across the Carpentaria Basin and in the Georgetown and Charters Towers Provinces.
In 2008, a magnetotelluric survey was performed over the same route.
In 2014, a similar seismic and complementary magnetotelluric survey was conducted between Longreach and Four Ways in North-West Queensland.
Magnetotellurics surveys
You can obtain data from the following two magnetotelluric (MT) surveys from GSQ:
- 2007 North Queensland MT survey
- 2009 Mount Isa MT survey
In the 2007 North Queensland MT survey, data was collected from a total of 116 sites and acquired along seismic lines 07GA-IG1, 07GA-IG2 and 07GA-CG1. The data was later reprocessed due to errors in sensor calibration and initial processing.
In the 2009 Mount Isa MT survey, a total of 240 stations were collected along seven profiles. Three profiles are coincident with, or adjacent to, the deep crustal seismic section acquired by GA and the GSQ. The remaining profiles were defined to assist with interpretation of the Millungera Basin area, east of Quamby. The image below shows coverage of GSQ deep magnetotelluric data in Queensland.

How to get the data
You can download open file (i.e. publicly available) airborne geophysical data and ground geophysical data (including gravity) as Geosoft geodatabases and Geosoft grid files from GSQ Open Data Portal.
Exploration geochemistry data
The Queensland exploration geochemistry database includes information on surface and drillholes. The data are generated from open file exploration reports submitted by mining companies doing mineral exploration work in Queensland.
Queensland surface and drillhole geochemistry database
This database provides a comprehensive collection of quality digital geoscience data enabling exploration activities to be targeted to prospective mineralised areas in Queensland.
Most of the data has been compiled under agreements between GSQ and external contractors. Additional data is being compiled by a new contract agreement with Map to Mine Pty Ltd that began in June 2014. While data is meticulously compiled and verified from open file company exploration reports, its accuracy is based on the integrity of the original data.
As at June 2014, the Queensland surface and drillhole geochemistry database contains 3,240,079 pieces of geochemical and drillhole data. The user-friendly digital data can be easily retrieved, interrogated, visualised and integrated into a GIS environment for a range of natural resource studies.
Database features
Key features of the database include:
- high-speed interrogation and sub-setting of data
- visualisation through direct integration with, or export to, industry standard GIS and exploration packages (e.g. MapInfo, Arcview, Interdex, Discover, Micromine, Surpac and generic ASCII)
- direct exporting to spreadsheets and word processing programs
- standardised geological codes (based on those used by Geoscience Australia) and
authority tables - ODBC compatible databases can be used as a back-end to the system.
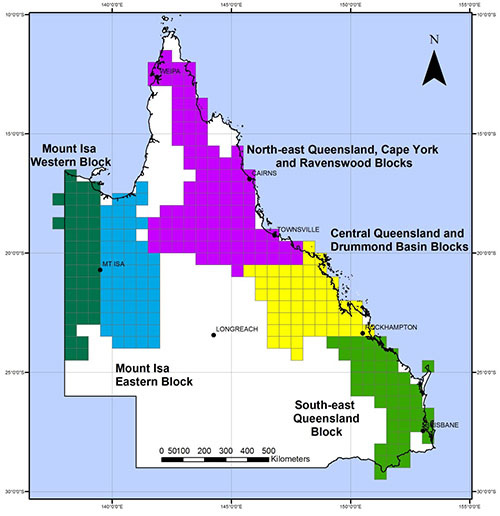
Data coverage
Data in the Queensland surface and drillhole geochemistry database has been packaged into the following data blocks for distribution:
- South East Queensland (SEQ)
- Central Queensland and Drummond Basin (CQ_DB)
- North East Queensland, Cape York and Ravenswood (NEQ_RB_CY)
- Eastern Mount Isa (MIE)
- Western Mount Isa (MIW)
Here is an image of data blocks in the Queensland surface and drillhole geochemistry database.
Number of data pieces for each block (as at June 2014)
| Blocks | Drillhole Location | Drillhole Sample | Drillhole Geology | Rock Chip |
|---|---|---|---|---|
| SEQ | 2,574 | 37,300 | 12,496 | 20,993 |
| CQ_DB | 8,958 | 124,294 | 50,378 | 43,993 |
| NEQ_RB_CY | 25,633 | 459,865 | 205,060 | 86,000 |
| MIE | 43,702 | 201,129 | 134,436 | 59,642 |
| MIW | 29,157 | 121,956 | 51,797 | 35,819 |
| TOTAL | 110,024 | 944,544 | 454,167 | 246,447 |
| Blocks | Stream Sedim's | Soils | Whole rock | Block Total |
|---|---|---|---|---|
| SEQ | 76,539 | 70,720 | 113 | 220,735 |
| CQ_DB | 85,474 | 123,785 | 2,982 | 439,864 |
| NEQ_RB_CY | 201,664 | 326,042 | 3,081 | 1,307,345 |
| MIE | 122,560 | 226,892 | 316 | 788,677 |
| MIW | 78,869 | 161,754 | 4,106 | 483,458 |
| TOTAL | 565,106 | 909,193 | 10,598 | 3,240,079 |
Type of data available
Data is provided on:
- tenure, sample and location—including prospect, company, sample type, sample number and location references
- lithologic and field information—including sampling methodology, lithology, alteration and mineralisation observations
- laboratory methodologies and assay information—including tabulated analytical methodologies, multi-element assays, assay job numbers and data sources
- drillholes—this may include core details, regolith, bulk density, water flow, geophysics, and collar and survey data.
Datum
The geodetic datum for the data is AGD66. The data supplied contains both grid coordinates in metres (easting and northing) and geographical coordinates in decimal degrees (latitude and longitude).
How to get the data
You can order a DVD with statewide digital geochemical data from us or you can download the data from the GSQ Open Data Portal.
(A data management program, Explorer 3, is distributed with the data. It is read-only with reporting and export options, but does not allow edits, deletions or additions. Inaccessible query functions in the cut-down version of Explorer 3 are greyed out. Explorer 3 is written in Visual Basic using a comprehensive data structure for Microsoft Access, SQL Server, Oracle and other ODBC compatible databases. The database also contains ASCII and MapInfo table formats.)
Digital geological mapping data
Digital geological data includes vector coverage of 1:100,000; 1:500,000; 1:1 million, 1:2 million and 1:2.5 million scale geological maps and raster colour scans of 1:250,000 scale geological maps.
You can check whether data is available in the:
- detailed geological data index (PDF 2MB), which shows vector and GIS data package coverage
- regional geological maps index (PDF, 1.21MB), which shows 1:500,000; 1:1 million and 1:2 million vector and hard copy map coverage.
Queensland geology and structural framework GIS data DVD (July 2012)
The Queensland geology and structural framework GIS dataset is a digital representation of the distribution or extent of rock units in Queensland, which mirrors the hard copy Queensland geology map that was published in 2012.
Queensland geology GIS
The Queensland geology GIS and map were compiled at a scale of 1:500,000 for output at a scale of 1:2 million by generalisation and simplification of our detailed digital geological data. This involved grouping the approximately 2,000 major rock units recognised in Queensland into 250 map units displayed in the GIS and hard copy map.
Rock units in the Queensland geology GIS are represented as polygons with a range of attributes, including:
- unit name
- unit type
- age
- lithological description
- dominant rock type
- abbreviated symbol to label each polygon.
Lines in the geology GIS represent the boundaries of geological units and other linear features such as faults and folds. A description is provided for each type of line represented.
Structural framework GIS
The structural framework GIS and map shows the distribution or extent of structural or tectonic units in which the rocks formed. These structural and tectonic subdivisions are known as basins (or in some cases troughs and depressions) where the original form and structure are still apparent. The subdivisions are known as provinces and sub-provinces where the basins have been so strongly tectonised and/or metamorphosed that their original extent and form are no longer preserved.
Pre-Mesozoic structural and tectonic units are grouped within orogenic parent units. Intrusive rocks and some volcanic rocks that overlap the basins and provinces have been excluded.
The structural framework GIS was compiled using boundaries modified and generalised from 1:2 million Queensland geology data. Outlines of subsurface basins were based on published interpretations from petroleum exploration and geophysical seismic, gravity and magnetics surveys.
Data format
The data on the DVD contains converted shapefiles, layer files and raster images derived from geodatabases and project .mxd files used to produce the Queensland Geology map and structural framework map published in hard copy format in 2012.
ESRI users
- A layer file is provided which presents the units in the colours and patterns used on the printed hard copy map.
MapInfo users
- A simplified colour palette is provided without patterns. However, a geo-referenced image of the hard copy map is included and can be displayed as a background in both ArcMap and MapInfo. Tab files have also been created for MapInfo users.
How to obtain a copy
You can obtain a copy of the Queensland geology and structural framework GIS data DVD from the Geological Survey of Queensland.
Geoldata: Queensland geological digital data – state, regional and detailed mapping (November 2012)
This product contains vector data that represents the current status of available data.
What data is included?
Data is presented on 2 DVDs—one containing detailed geological map data, and another containing regional geological map datasets. It also includes:
- solid geological interpretation of the North West Queensland Mineral and Energy Province (NWQMEP), Georgetown and Charters Towers GIS areas
- information about the Queensland Structural Framework
- information about Queensland geology.
Data coverage
The detailed geological map data DVD includes new and updated seamless geology and data for:
- North West Queensland Mineral and Energy Province (with topological errors corrected)
- Hodgkinson Province
- South East Queensland
- North Connors Province
- Drummond Basin (with topological errors corrected).
The regional geological map data DVD contains data captured from 1:500,000 and 1:1 million scale maps covering most of Queensland.
Data formats
Data is supplied as:
- fully attributed geological lines and polygons in MapInfo tab and ESRI shapefile formats, in geographic coordinates based on the Geocentric Datum of Australia (1994)
- metadata file attachments in .xml and .html formats for each map tile
- 1:250,000 tile name_structures.lyr and 1:250,000 tile name_structures.tab to symbolise structural layers
- geological unit polygons in RGB colours that approximate those defined in the Australian Standard Colour Scheme for geological maps. Colour values have been chosen based on the age and rock unit type attribute of each polygon key held in the source geological resources database. (Note that the colours provided in the .lyr and .tab files are solid colours only and may not exactly match the colour that is printed on the corresponding hard copy geological map.) You can view the colours in the following files:
- 1:250,000 tile name_rock_units.lyr in ESRI folders
- 1:250,000 tile name_rock_units_rgb.tab in MapInfo folders
You can download approximately 135 PDF files created from postscripts of recently published 1:100,000 maps or scans of regional sheets from the GSQ Open Data Portal.
How to obtain a copy
You can order a copy from the Geological Survey of Queensland.
Queensland geological mapping raster data images of 1:250,000 geological map sheets (2009)
This DVD contains scans of all published 1:250,000 geological maps. JPEG images of the map faces are geo-referenced to AGD66 latitude/longitude coordinates.
How to get a copy
You can order a copy of the DVD from the Geological Survey of Queensland.
GIS packages containing vector data
Many map areas are also included in GIS information and datasets.
As GIS packages do not usually get updated after their release, map tiles in the Geoldata: Queensland geological digital data – state, regional and detailed mapping product may be more current.
GIS datasets
The Geological Survey of Queensland (GSQ) compiles GIS information packages that feature major regional studies reports. However, if errors are fixed or maps are updated after their release, the packages are not usually updated to reflect those changes. It may therefore be advantageous to purchase both the GIS information package and digital geological mapping data which contains more up-to-date information.
While GIS were built using now superseded versions of ESRI and MapInfo software, the shape and tab files are still compatible. ESRI versions were assembled using ArcView 3.2, so when ArcView (.apr) project files are imported into ArcMap, the colour symbolisation of geological units does not completely convert. There may also be issues with workspace (.wor) files in MapInfo.
South-East Queensland GIS, Version 2 (November 2002)
This integrated digital geological compilation covers an area from the New South Wales border, north to Rainbow Beach, and west to Toowoomba.
What data is included?
Datasets in the product include:
- geological boundaries
- structure
- current and abandoned mine locations
- geological site information
- isotopic rock age dates
- stratigraphic drilling locations
- geochemistry
- tenure (historical and current) as at October 2002
- coal resource areas and quarry data
- geophysical images with interpretations of the magnetic image.
Data coverage
The product contains seamless geological data compiled at a nominal scale of 1:100,000 for the following 1:100,000 map sheets:
- Laguna Bay
- Gympie
- Goomeri
- Murgon
- Boondooma
- Jandowae
- Nanango
- Kingaroy
- Nambour
- Caloundra
- Esk
- Oakey
- Toowoomba
- Caboolture
- Brisbane
- Helidon
- Ipswich
- Beenleigh
- Warwick
- Mount Lindesay
- Murwillumbah.
Data format
The data comes from GSQ's regional geological mapping programs, university theses and exploration company mapping, and is supplied in both ArcView and MapInfo formats.
Yarrol-Connors-Auburn GIS, Version 2 (June 2005)
This integrated digital geological compilation for the Central Queensland region covers an area from Mackay in the north, to Mundubbera in the south, and is centred on the former world-class gold deposit at Mount Morgan.
What data is included?
Datasets in the product include:
- geology of the area
- solid geology based on tectonic setting
- airborne magnetic and radiometric images
- gravity images
- landsat images
- geophysical interpretation
- whole rock geochemical and geochronological data for igneous units
- locations of historical exploration tenures
- locations and descriptions of approximately 1,600 mineral occurrences
- over 26,000 geological site observations.
Data coverage
The package contains results of detailed GSQ geological and mineral occurrence mapping programs from 1995 to 1999 for the following 1:250,000 map sheets:
- Mackay
- St Lawrence
- Rockhampton
- Duaringa
- Mundubbera
- Monto.
Data format
Data is supplied in both ArcView and MapInfo formats and can also be viewed using the Geoviewer software provided.
North Queensland gold and base metals study
The North Queensland gold and base metals study was conducted in two stages. The first stage covered the Georgetown (Etheridge and Croydon) region and the second stage covered the Charters Towers region.
The reinterpretation of data for these regions involved a desktop analysis using geophysical data acquired through original mapping, followed by limited field checking of significant geological revisions.
Stage 1: Georgetown (November 2002)
The North Queensland Gold and Base Metals Study, Georgetown, is an integrated digital geological information package for the Georgetown area.
The Georgetown area is most prospective for epithermal gold systems, the Broken Hill type base metal mineralisation model, Kidston-Mount Leyshon type gold model, and possibly Carlin style mineralisation.
What data is included?
Datasets in the product include:
- geology and explanatory notes
- mineral occurrences
- geophysical images
- interpreted magnetic lineaments
- whole rock geochemistry
- geological field observations
- historic exploration tenure
- solid geology interpretation (excluding alluvium, soils, regolith and Mesozoic age rocks).
Data coverage
The data covers the following 1:100,000 map sheets:
- Lyndbrook
- Bullock Creek
- Croydon
- Gilbert River
- Forest Home
- Georgetown
- Mount Surprise
- Saint Ronans
- Prospect
- Esmeralda
- North Head
- Forsayth
- Einasleigh
- Conjuboy
- Pelham
- Bellfield
- Gilberton
- Lyndhurst
- Burges
- Etherdale
- Mount Norman
- Hampstead.
Data format
The data is supplied in both ArcView and MapInfo formats.
Stage 2: Charters Towers (November 2003)
The North Queensland Gold and Base Metal Study, Charters Towers, is an integrated digital geological information package for the Charters Towers area.
The Charters Towers area is most prospective for mesothermal granite-hosted veins (Charters Towers), intrusive-related, breccia-hosted (Mount Leyshon), and mesothermal multiphase vein (Nolan's-Sarsfield) gold deposit styles and volcanic-hosted massive sulphide deposit styles (Highway, Reward and Thalanga).
What data is included?
Datasets in the product include:
- geology (surface and basement) and explanatory notes
- mineral occurrences
- geophysical images
- interpreted magnetic lineaments
- geological field observations
- whole rock geochemistry
- exploration geochemistry sample locations
- topographic map themes
- historic exploration tenure
- basement geology interpretation (excluding alluvium, soils, regolith and some Mesozoic age rocks).
Data coverage
The data covers the following 1:100,000 map sheets:
- Conjuboy
- Valley of Lagoons
- Kangaroo Hills
- Ingham
- Palm Islands
- Burges
- Clarke River
- Ewan
- Rollingstone
- Townsville
- Chudleigh Park
- Wandovale
- Maryvale
- Hillgrove
- Dotswood
- Mingela
- White Mountains
- Lolworth
- Homestead
- Charters Towers
- Ravenswood
- Pentland (part of).
Data format
The data is supplied in both ArcView and MapInfo formats.
How to get the GIS data
You can download these data packages from GSQ Open Data Portal.
Mineral occurrence and geological observation data
Mineral occurrence and geological observation data packages have been decoded and concatenated into simple, relational database structures with MS Access software interfaces and in-built forms and queries to interrogate the data.
Most tables include latitude and longitude, and MGA zone and coordinates for easy display in GIS software such as ArcGIS and MapInfo. Many tables have also been populated with corresponding rock unit and structural unit names.
Mineral occurrence database
Queensland mineral occurrence data includes geological and statistical information on operating mines, abandoned mines, active and dormant mineral prospects, and known mineral occurrences in Queensland (PDF, 214KB).
The mineral occurrence database (MINOCC), which is updated annually, contains:
- comprehensive information gathered from field investigations, reports dating from last century to the present, reviews of company exploration results, company annual reports and industry publications
- details of the deposit model, host rock and ore-body geology, production history and resources
- bibliography for each individual deposit, along with comments.
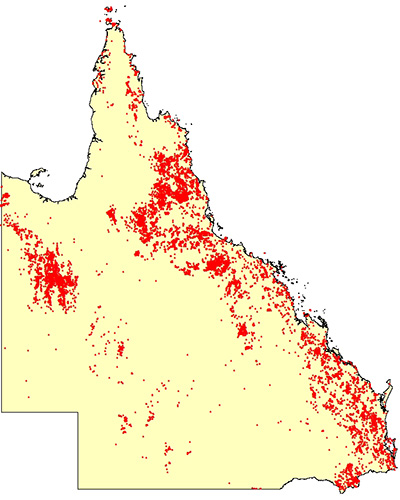
Distribution of mineral occurrence and major mines sites in MINOCC database
Geological observation database
Geological observation data (approximately 182,000 sites) has been captured during the Geological Survey of Queensland (GSQ) geological mapping activities since 1986. The geological observation database includes data on rock types and rock characteristics, such as colour, grain size, texture, structural measurements and formation name. It also includes isotopic dates and whole rock geochemistry. Here is an image showing the distribution of geological observations that GSQ has collected since 1986, including some data captured from earlier field notebooks.
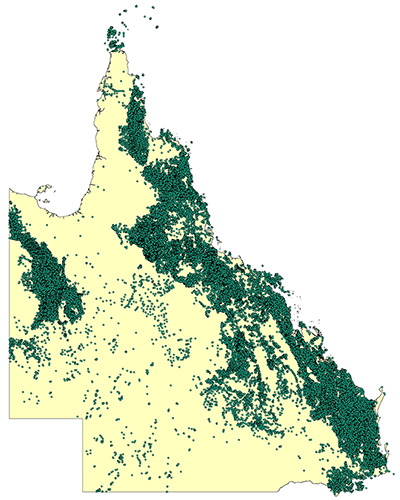
Distribution of geological observation sites (including legacy data sites) in GRDB database
Approximately 2,650 isotopic dates (SHRIMP, U-Pb, K-Ar) include age determinations obtained through GSQ regional mapping activities and also from many other sources available in the public domain.
The whole rock chemistry is a compilation of all the analyses (12,720) from GSQ regional mapping activities and analyses completed in conjunction with Geoscience Australia. These analyses have been used to classify rock types and improve understanding of Queensland's geology.
How to get the data
You can download the Geological observations data package and the Mineral occurrence data package from the GSQ Open Data Portal.
Petroleum geoscience and wireline log data
Data on the petroleum potential of Queensland is collated from petroleum and coal seam gas well completion reports and stratigraphic drilling reports. This data is collated in our corporate database and extracts are provided as the Queensland Petroleum Exploration Database (QPED).
Open file seismic survey, well completion and other petroleum exploration reports can be accessed through the GSQ Open Data Portal.
Queensland Petroleum Exploration Database
The Queensland Petroleum Exploration Database (QPED) contains subsurface geological information on Queensland's sedimentary basins. Data is derived from petroleum and coal seam gas wells completion reports and stratigraphic boreholes. This includes the open file data relating to over 12,000 wells and boreholes throughout Queensland.
Open file data is supplied digitally as 32 Microsoft Excel and CSV files which can be linked using the unique bore number. These files include:
- analyses carried out
- basin or structural province intersected
- biostratigraphic data
- casing details
- coal petrology data
- company report references company stratigraphic picks (relative to KB)
- cored intervals
- cuttings samples
- downhole and bottom hole temperatures data
- drill stem test details
- extract geochemistry data
- gas analysis data
- geographic and MGA coordinates (GDA94 datum)
- GSQ stratigraphic picks (relative to KB)
- hole deviation data
- hydrocarbon indications
- laboratory names
- oil analysis data
- operator names
- petrophysical data (e.g. porosity and permeability)
- plugged intervals
- proximate analysis data
- pyrolysis data
- rock unit ages
- sidewall cores samples
- vitrinite reflectance data
- water analysis data
- well history details
- wireline logged intervals
- other references (e.g. papers and records).
Seismic survey information and data
All seismic survey data for Queensland, including processed and support data, can be downloaded from the GSQ Open Data Portal.
Queensland seismic survey reports can be downloaded from the GSQ Open Data Portal.
The location of 2D and 3D seismic surveys in Queensland can be downloaded from QSpatial.
Wireline log data
Open file wireline log data is available for download as part of well completion reports from the GSQ Open Data Portal.
Wireline logs are distributed as submitted and include LAS, DLIS and LIS formats, as well as PDF and TIFF prints of logs. A collation of LAS files for wells open file prior to June 2013 is also available for download from the GSQ Open Data Portal.
Well data can also be downloaded from QSpatial. This is the final update of the Petroleum geoscience and wireline log data DVD.
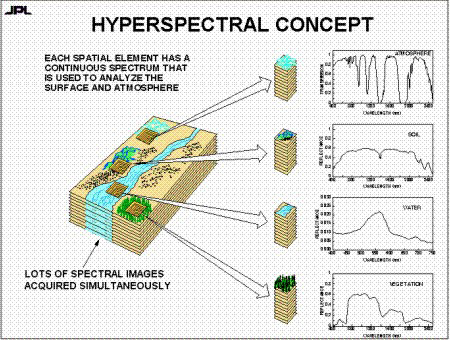
Hyperspectral image maps
Hyperspectral surveys enable rapid and no impact data collection, and help explorers to evaluate mineral deposit models in areas of interest. They complement satellite imagery, aerial photography, magnetics, radiometrics and gravity surveys. The resulting mineral, chemistry, vegetation and surface texture maps are used to identify areas of alteration and enable mineral emplacement models to be tested.
Hyperspectral data can also relate to mineral occurrences, tenement boundaries, geology and geophysics.
Queensland Next Generation Mineral Mapping project
In 2006–07, hyperspectral surveys were conducted to collect 25,000km2 of data from North Queensland, as part of the Queensland Next Generation Mineral Mapping (NGMM) project. The project involved surveying 25 swaths, 15km wide and of varying lengths, in the Mount Isa, Georgetown, Palmerville Fault and Pajingo regions.
The latest approaches in hyperspectral surveying were used in the project; and CSIRO Exploration and Mining supervised data collection and completed data reduction and interpretation. The project used the airborne HyMap sensor (HyVista Corporation) at a spatial resolution of 4.5m.
HyMap is a passive system that records data on reflected sunlight in the visible to short wavelength infra-red spectrum. The data is then used to map the distribution of selected minerals on the land surface, and provide natural and false colour high-resolution images. Vegetation, dust and pollution can also be mapped using hyperspectral datasets.
The outcomes of the project were released in 2009 in the form of a report and series of over 500 GIS-compatible image maps showing surface mineralogy, chemistry, vegetation and landscape textures. Here is a diagram of the hyperspectral concept.
Stage 1: 2006 hyperspectral survey
The survey was focused on the Mount Isa region and covered a total length of approximately 570km and total area of approximately 8,250km2. The following areas were targeted due to their significant known deposits:
- Mount Isa (Cu, Pb, Zn)
- Century (Zn)
- Cannington (Zn, Ag)
- Lady Loretta (Zn)
- Dugald River (Pb, Zn)
- Tick Hill (Au)
- Cloncurry (Cu, Au)
- Selwyn (Cu)
- Mary Kathleen (U).
Summary of swaths:
- Termite Range – extends along Termite Range Fault, south-east from Century
- Lady Loretta-Dugald River – along seismic line
- Pilgrim – extends along major faults from Tick Hill to Dugald River
- Selwyn – extensively mineralised area
- Cloncurry – along Cloncurry Fault.
Funding for stage 1 of the survey was provided by the Queensland Smart Exploration Program. Stage 1 HyMap geoscience products and associated ground/laboratory data were released in July 2007.
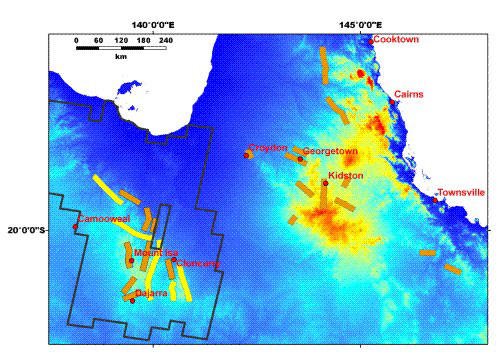
Stage 2: 2007 hyperspectral survey
Stage 2 included further coverage of Mount Isa, as well as other areas to the east with proven mineral endowment. The total length of the survey was approximately 1,117km and the total area of the survey was approximately 16,750km2.
Funding for stage 2 of the project was provided by the Smart Mining Future Prosperity Program. Stage 2 data was released in July 2008.
Here is an image showing the location of airborne HyMap data coverage throughout Queensland, as well as the ASTER image coverage over Mount Isa.
How to get the data
Over 20 image maps are available for each swath, and 14 image maps were produced showing various surface materials. The hyperspectral data was also used to calibrate an ASTER satellite mosaic assembled for the entire Mount Isa region.
The data and maps are available for free download from the CSIRO Data Access Portal.
Hymap images are also available from the GSQ Open Data Portal.
The images are readily loaded into GIS software such as ArcMap and MapInfo, and free plugins are available if needed.
Participants
The CSIRO, HyVista Corporation, Geoscience Australia and James Cook University also participated in the survey.
© The State of Queensland 1995–2026