The Statewide Landcover and Trees Study (SLATS) monitors woody vegetation extent, and changes to that extent due to clearing and regrowth using Sentinel-2 satellite imagery as its primary monitoring tool.
The 2020–21 SLATS reporting period is nominally from August 2020 to August 2021. Regional summary data for bioregions are also included in the report. The 2020–21 report and data are directly comparable with the 2018–19 report and 2019–20 report. However they are not comparable with SLATS reports up to and including 2017–18 due to a change in methodology.
Introduction
Overview—Mapping and monitoring woody vegetation ecosystems
With an area of approximately 173 million hectares, Queensland is the second largest state in Australia. It is nearly five times the size of Japan and seven times the size of Great Britain. It is home to diverse flora and fauna due to its unique habitats which include extensive arid and semi-arid rangelands, and temperate, sub-tropical and tropical environments.
Queensland has more than 1,400 regional ecosystems with the majority of these described as woody regional ecosystems. These woody regional ecosystems include the sparse and very sparse shrublands and woodlands of the extensive arid and semi-arid rangelands, and the sparse woodlands and mid-dense and dense forests and rainforests along the Great Dividing Range, coastal plains, and in the Cape York Peninsula and Wet Tropics bioregions. These ecosystems play a critical role in supporting biodiversity, maintaining landscape function and water quality, supporting agricultural production, sequestering and storing atmospheric carbon dioxide, and providing recreation and natural amenity. To conserve, protect, and sustainably use these ecosystems in a changing climate, it is essential to have spatial and temporal data and information to characterise their composition and structure and to monitor their dynamics.
In Queensland, the regional ecosystems framework provides the basis for describing the vegetation types and their remnant status. The Statewide Landcover and Trees Study (SLATS) monitors woody vegetation extent, and changes to that extent due to clearing and regrowth, using Sentinel-2 satellite imagery as its primary monitoring tool. A Spatial BioCondition framework has also been developed to characterise and map the condition of the state’s regional ecosystems. Combined, these initiatives provide a spatially and temporally comprehensive account of Queensland’s ecosystems based on peer-reviewed science.
About this report
The current series of SLATS reporting monitors and reports change in woody vegetation extent against a woody extent baseline, first introduced in 2018 and updated annually based on mapping of woody vegetation clearing and regrowth. Additional scientific approaches have also been developed to attribute the degree of modification associated with the clearing activity and to provide estimates of woody vegetation density and age since disturbance, that is, when the vegetation was last disturbed or began to regrow following a disturbance event. These approaches aim to better describe the woody vegetation that currently exists, and where and how its extent is changing.
The 2020–21 SLATS report is nominally for the period August 2020 to August 2021. Regional summary data for bioregions are also included. The 2020–21 report and data are directly comparable with the 2018–19 report and 2019–20 report. However, they are not comparable with previous SLATS reports up to and including 2017–18 due to a change in methodology.
It is important to note that clearing activity mapped by SLATS in remnant and high-value regrowth areas does not always result in a conversion to non-remnant. The Queensland Herbarium uses SLATS data to inform remnant and high-value regrowth updates as part of regular regional ecosystem updates. These updates consider the clearing activity as well as a range of other criteria associated with the regional ecosystem mapping methodology, including the remnant and high-value regrowth definitions. For data and information on change in remnant vegetation, visit Remnant regional ecosystem vegetation in Queensland.
Note: There may be slight differences in the reported area figures compared with areas derived from the published SLATS spatial data. This is due to differences in the way the areas are represented in published SLATS vector data sets (i.e. data is represented in a polygon format) compared with raster data sets (i.e. data represented in a grid format) which are used for reporting. For the same reason, there may also be slight differences between figures stated in the SLATS 2020–21 report and the figures provided in the SLATS vegetation management analysis. Also, due to re-processing and some rounding, previously reported figures may differ slightly to figures and data files provided with the 2020–21 report.
Key findings
Key findings
At the start of the 2020–21 SLATS monitoring period, Queensland had 95,677,148 hectares (ha) of woody vegetation with more than 10% crown cover.
Approximately 7.6 million ha of this woody vegetation is existing regrowth. The remainder is remnant or high-value regrowth woody vegetation.
In 2020–21, 349,399ha of woody vegetation was affected by clearing activity. This is a 17% decrease in clearing activity from 2019–20 (418,656ha) and a 49% decrease from 2018-19 (680,688ha).
Of the total clearing activity, 322,515ha (92% of all clearing activity) resulted in full removal of the woody vegetation (i.e. ‘full clearing’). This is a 5% decrease in full clearing from 2019–20. The remaining 26,884ha of clearing activity in 2020–21 was partial clearing.
In 2020–21, 59,654ha of new regrowth was mapped. It is important to note that most of the state’s existing regrowth is already included in the SLATS woody extent baseline. New regrowth is only mapped if it can be reliably detected using SLATS methods.
At the end of the 2020–21 SLATS monitoring period, Queensland had 95,414,287ha of woody vegetation. From a starting balance of 95,677,148ha, 322,515ha was subtracted for full clearing and 59,654ha was added for new regrowth. This represents a net reduction of 262,861ha in the extent of the state’s woody vegetation from 2019–20.
Key findings—clearing activity
About 15% (54,136ha) of the statewide clearing activity was in Category B (remnant) areas—a 39% decrease from 2019–20 (88,327ha). Just over two-thirds of this Category B clearing activity (70% or 37,888ha) resulted in full removal of the woody vegetation.
About 1% (4,701ha) of the statewide clearing activity was in Category C (high-value regrowth vegetation), and less than 1% (2,321ha) was in Category R (regrowth watercourse area).
Clearing activity in Category X areas (i.e. those areas not generally regulated by the Vegetation Management Act 1999) accounted for 82% (288,165ha) of the total clearing activity in Queensland. Most of this resulted in full removal of the woody vegetation (278,884ha or 97% of all Category X clearing activity).
Less than 1% (2,714ha) of the statewide clearing activity was in areas that have endangered regional ecosystems present and about 3% (10,546ha) was in areas that have of concern regional ecosystems. About 14% (49,850ha) of the clearing activity was in areas that have least concern regional ecosystems present.
Of the state’s 13 bioregions, the Brigalow Belt (52% or 180,283ha) and Mulga Lands (21% or 72,238ha) accounted for nearly three-quarters (72%) of the state’s woody vegetation clearing activity. In each of these bioregions, over 90% of the clearing activity was mapped as full clearing.
Clearing activity in the Great Barrier Reef catchment areas accounted for 47% (164,766ha) of the state’s total clearing. This was a 10% decrease in clearing activity from 2019–20 (182,904ha). About 90% (148,507ha) of the clearing in reef catchments resulted in the full removal of the woody vegetation.
About 89% (310,339ha) of the statewide clearing activity was attributed to the pasture landcover replacement class. Of this, about 96% was full clearing. A further 4% (12,905ha) of the clearing activity was attributed to forestry. The crop (5,156ha) and mine (4,736ha) landcover replacement classes each contributed about 1% of the total clearing activity.
About 91% (317,866ha) of the total clearing activity occurred in sparse or very sparse woody vegetation (i.e. vegetation with less than 50% crown cover). A further 9% (29,851ha) of the clearing activity occurred in mid-dense vegetation (i.e. 50-80% crown cover).
Based on estimates of woody vegetation ‘age since disturbance’, about 52% (182,913ha) of the total clearing activity occurred in vegetation estimated to be greater than 15 years old (refer to note). About 36% (125,765ha) of the total clearing occurred in vegetation that was estimated to be less than 15 years old. The remainder (12% or 40,721ha) occurred in woody vegetation where a valid ‘age since disturbance’ estimate could not be determined.
Key findings—regrowth
Of the state’s 13 bioregions, the Brigalow Belt bioregion had the greatest area of new regrowth mapped, contributing 39% (23,454ha) to the state’s total. The Southeast Queensland bioregion had the next greatest area of new regrowth mapped, contributing about 20% (12,229ha) to the state’s total.
About 67% (39,837ha) of the new regrowth mapped was attributed to the pasture landcover class, and about 24% (14,531) attributed to forestry. A further 7% (4,041ha) was mapped as crop, largely due to new tree-crop orchards in parts of Southeast Queensland (Burnett-Mary) and Wet Tropics (around Atherton) bioregions.
Of the new regrowth mapped, about 80% (47,933ha) was categorised as either sparse or very sparse woody vegetation, and 20% (11,686ha) as mid-dense woody vegetation.
Of the new regrowth mapped, 70% (41,484ha) was estimated to be less than 15 years old.
Note: Since the release of 2018–19 SLATS report, the methods for estimating the age since disturbance of woody vegetation have been refined and data updated. The estimates are based on time-since-cleared data derived from SLATS clearing histories, and time-series analysis of more than 30 years of Landsat satellite imagery aimed at detecting woody vegetation disturbance and regrowth. The age since disturbance estimates use the time-series information where sufficient evidence is available to assign a valid estimate of how long the woody vegetation has been regrowing following a disturbance event. These updates have resulted in the following for SLATS reporting and published data:
the 2018–19 SLATS reporting has not been revised and remains as reported
the updated age since disturbance estimates have been used in the 2019–20 SLATS reporting and this 2020–21 SLATS report
the age since disturbance spatial data available in QSpatial includes the updated estimates
the updated age estimates for all monitoring periods have been used in all relevant data files that can be accessed from this 2020–21 SLATS report.
For more information on how the age since disturbance estimates are derived, refer to the SLATS methodology. It is important to note that woody vegetation that is greater than 15 years is not always considered to be remnant or high-value regrowth, as additional criteria such as species composition and vegetation height are used to determine remnant or high-value regrowth status. This is determined by the Queensland Herbarium as part of the regional ecosystem mapping framework.
Statewide overview
Key findings
At the start of the 2020–21 SLATS monitoring period, Queensland had 95,677,148 hectares (ha) of woody vegetation with more than 10% crown cover.
Approximately 7.6 million ha of this woody vegetation is existing regrowth. The remainder is remnant or high-value regrowth woody vegetation.
In 2020–21, 349,399ha of woody vegetation was affected by clearing activity. This is a 17% decrease in clearing activity from 2019–20 (418,656ha) and a 49% decrease from 2018-19 (680,688ha).
Of the total clearing activity, 322,515ha (92% of all clearing activity) resulted in full removal of the woody vegetation (i.e. ‘full clearing’). This is a 5% decrease in full clearing from 2019–20. The remaining 26,884ha of clearing activity in 2020–21 was partial clearing.
In 2020–21, 59,654ha of new regrowth was mapped. It is important to note that most of the state’s existing regrowth is already included in the SLATS woody extent baseline. New regrowth is only mapped if it can be reliably detected using SLATS methods.
At the end of the 2020–21 SLATS monitoring period, Queensland had 95,414,287ha of woody vegetation. From a starting balance of 95,677,148ha, 322,515ha was subtracted for full clearing and 59,654ha was added for new regrowth. This represents a net reduction of 262,861ha in the extent of the state’s woody vegetation from 2019–20.
Clearing activity in Queensland in 2020–21
In 2020–21, a total of 349,399ha of woody vegetation was affected by clearing activity in Queensland—this includes full and partial clearing. This is a 17% decrease in clearing activity from 2019–20 (418,656ha) and a 49% decrease from 2018–19 (680,688ha). Of the total clearing activity undertaken in 2020–21, 322,515ha (92% of all clearing activity) resulted in full removal of the woody vegetation (i.e. full clearing). The remaining 26,884ha of clearing activity was partial clearing.
Area of clearing activity from 2018–19 to 2020–21.
Full clearing refers to areas which have been converted from woody to non-woody (i.e. less than 10% crown cover remains).
Partial (major) are clearing areas where the woody vegetation has been significantly modified but remains woody (i.e. greater than 10% crown cover remains but more than 50% of the area has been affected by the clearing).
Partial (minor) are clearing areas where some modification of the woody vegetation has occurred, remaining woody (i.e. greater than 10% crown cover remains but less than 50% of the area has been affected by the clearing).
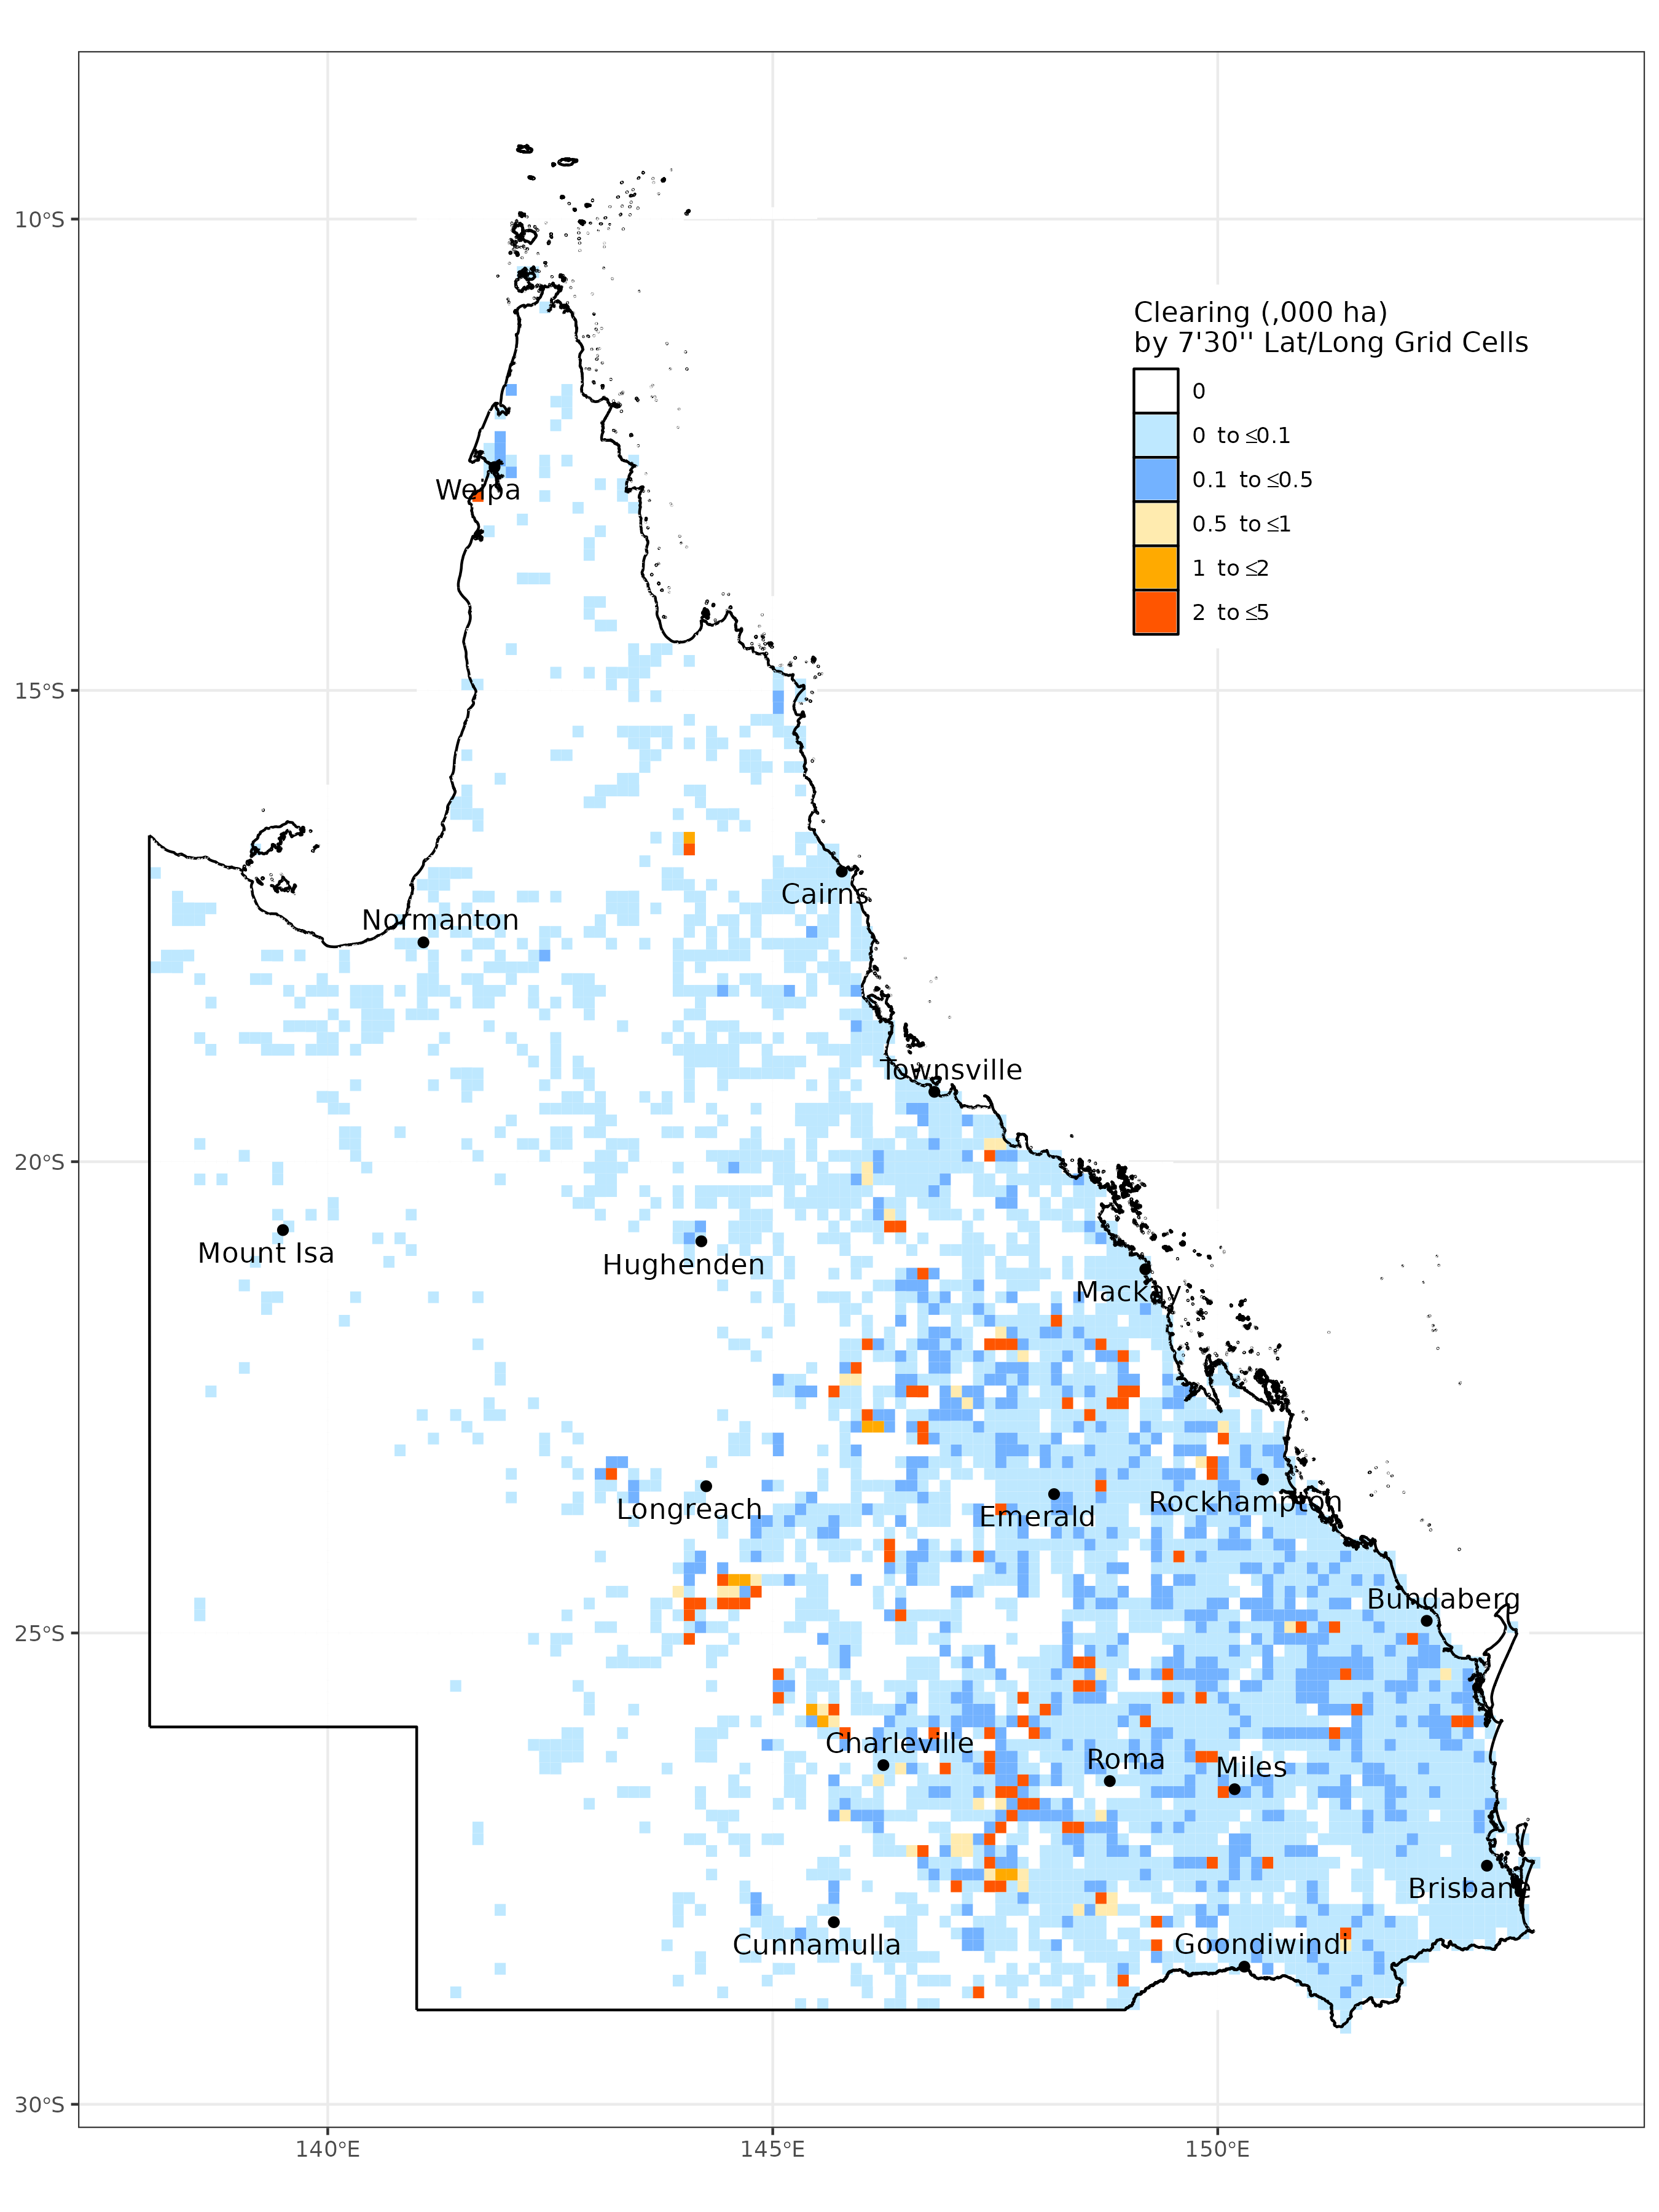
Spatial distribution of clearing activity 2020–21
View larger image
Map of the spatial distribution of all clearing activity mapped in Queensland in 2020–21, summarised by 7’30” latitude/longitude grid cells (each cell is approx. 17,500ha). Red and orange cells indicate that a greater area of clearing activity has occurred at that location.
Regrowth in Queensland in 2020–21
At the start of the 2020–21 monitoring period, approximately 7.6 million ha of the state’s woody vegetation was not mapped as remnant or high-value regrowth vegetation and is therefore assumed to be existing regrowth woody vegetation.
In the 2020–21 monitoring period, 59,654ha of new regrowth was mapped. These are areas that were not previously mapped in the 2018 woody vegetation extent baseline or in the 2019–20 monitoring period and are only now considered to have sufficient woody vegetation cover to be added to the woody extent. Given most of the existing regrowth was captured in the 2018 baseline, high levels of new regrowth would not be expected in the first few years to follow. This is due to the generally longer timeframes it takes for new regrowth to become sufficiently woody to enable reliable identification and mapping.
Regrowth are new woody vegetation areas which have regrown sufficiently to be added to the SLATS woody extent. Regrowth was not reported in 2018-19.
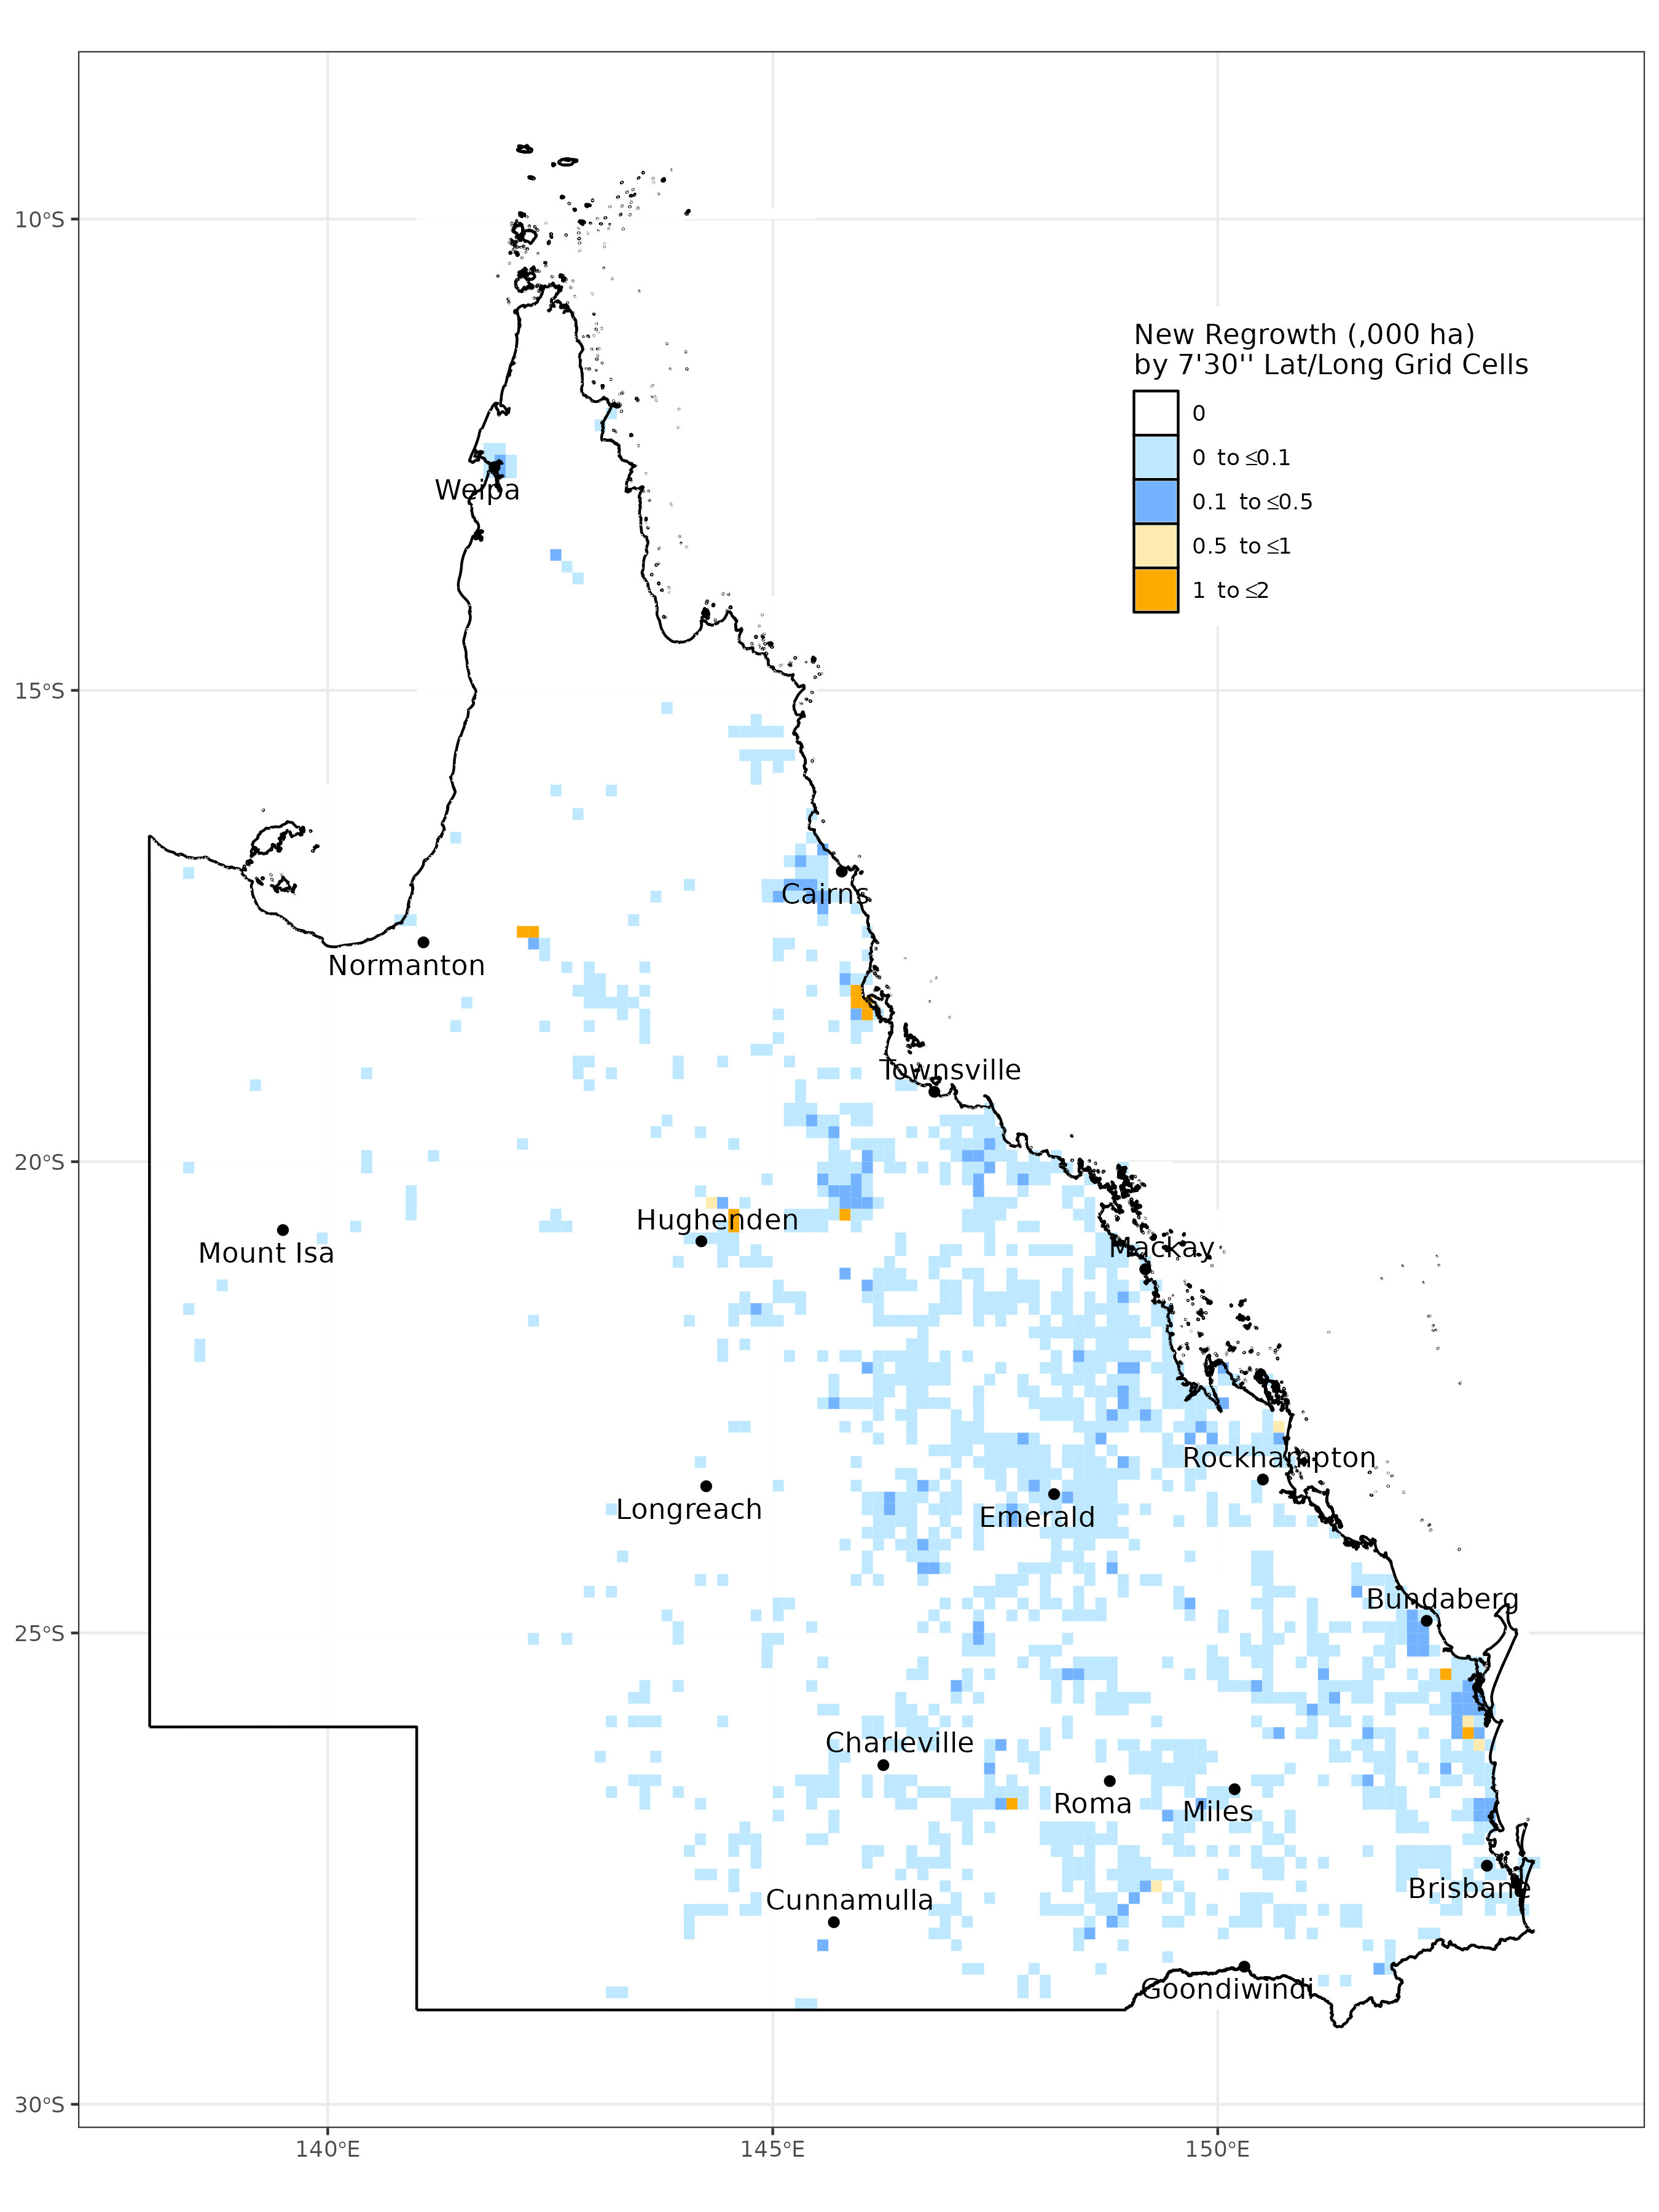
Spatial distribution of regrowth 2020–2021
View larger image
Map of the spatial distribution of all new regrowth mapped in Queensland in 2020–21, summarised by 7’30” latitude/longitude grid cells (each cell is approx. 17,500ha). Red and orange cells indicate that a greater area of regrowth has occurred at that location.
Woody vegetation extent change in Queensland in 2020–21
At the end of the 2020–21 SLATS monitoring period, Queensland had 95,414,287ha of woody vegetation. From a starting balance of 95,677,148ha, 322,515ha was subtracted for full clearing and 59,654ha was added for new regrowth. This represents a net reduction of 262,861ha in the extent of the state’s woody vegetation from 2019–20.
Transaction summary 2020–21
Category
Gain (ha)
Loss (ha)
Balance (ha)
Opening balance August 2020
-
-
95,679,990
Adjustment
10,245
-13,088
95,677,148
Crop
4,041
-5,156
95,676,033
Forestry
14,531
-11,312
95,679,252
Infrastructure
86
-2,243
95,677,095
Mine
1,117
-4,736
95,673,476
Pasture
39,837
-297,881
95,415,432
Settlement
42
-1,187
95,414,284
Closing balance August 2021
-
-
95,414,287
This transaction summary shows the opening balance of woody vegetation at the start of the 2020–21 monitoring period, the losses due to clearing activity that resulted in the full removal of the woody vegetation, and the gains due to new regrowth, for each landcover replacement class. Loss and gain adjustments were made to correct for areas in the woody extent that were identified as previous errors during the SLATS mapping processes. A closing balance at the end of the 2020–21 monitoring period is provided.
While these figures represent a net reduction in woody vegetation extent, it is important to acknowledge that not all vegetation change is equal. For example, clearing in remnant areas cannot be directly compared with clearing in non-remnant areas in terms of the impacts on biodiversity, carbon or landscape function. Similarly, new regrowth does not offset remnant loss for the same reasons.
Statewide breakdown
Key findings—clearing activity
About 15% (54,136ha) of the statewide clearing activity was in Category B (remnant) areas—a 39% decrease from 2019–20 (88,327ha). Just over two-thirds of this Category B clearing activity (70% or 37,888ha) resulted in full removal of the woody vegetation.
About 1% (4,701ha) of the statewide clearing activity was in Category C (high-value regrowth vegetation), and less than 1% (2,321ha) was in Category R (regrowth watercourse area).
Clearing activity in Category X areas (i.e. those areas not generally regulated by the Vegetation Management Act 1999) accounted for 82% (288,165ha) of the total clearing activity in Queensland. Most of this resulted in full removal of the woody vegetation (278,884ha or 97% of all Category X clearing activity).
Less than 1% (2,714ha) of the statewide clearing activity was in areas that have endangered regional ecosystems present and about 3% (10,546ha) was in areas that have of concern regional ecosystems. About 14% (49,850ha) of the clearing activity was in areas that have least concern regional ecosystems present.
Of the state’s 13 bioregions, the Brigalow Belt (52% or 180,283ha) and Mulga Lands (21% or 72,238ha) accounted for nearly three-quarters (72%) of the state’s woody vegetation clearing activity. In each of these bioregions, over 90% of the clearing activity was mapped as full clearing.
Clearing activity in the Great Barrier Reef catchment areas accounted for 47% (164,766ha) of the state’s total clearing. This was a 10% decrease in clearing activity from 2019–20 (182,904ha). About 90% (148,507ha) of the clearing in reef catchments resulted in the full removal of the woody vegetation.
About 89% (310,339ha) of the statewide clearing activity was attributed to the pasture landcover replacement class. Of this, about 96% was full clearing. A further 4% (12,905ha) of the clearing activity was attributed to forestry. The crop (5,156ha) and mine (4,736ha) landcover replacement classes each contributed about 1% of the total clearing activity.
About 91% (317,866ha) of the total clearing activity occurred in sparse or very sparse woody vegetation (i.e. vegetation with less than 50% crown cover). A further 9% (29,851ha) of the clearing activity occurred in mid-dense vegetation (i.e. 50-80% crown cover).
Based on estimates of woody vegetation ‘age since disturbance’, about 52% (182,913ha) of the total clearing activity occurred in vegetation estimated to be greater than 15 years old (refer to note). About 36% (125,765ha) of the total clearing occurred in vegetation that was estimated to be less than 15 years old. The remainder (12% or 40,721ha) occurred in woody vegetation where a valid ‘age since disturbance’ estimate could not be determined.
Key findings—regrowth
Of the state’s 13 bioregions, the Brigalow Belt bioregion had the greatest area of new regrowth mapped, contributing 39% (23,454ha) to the state’s total. The Southeast Queensland bioregion had the next greatest area of new regrowth mapped, contributing about 20% (12,229ha) to the state’s total.
About 67% (39,837ha) of the new regrowth mapped was attributed to the pasture landcover class, and about 24% (14,531) attributed to forestry. A further 7% (4,041ha) was mapped as crop, largely due to new tree-crop orchards in parts of Southeast Queensland (Burnett-Mary) and Wet Tropics (around Atherton) bioregions.
Of the new regrowth mapped, about 80% (47,933ha) was categorised as either sparse or very sparse woody vegetation, and 20% (11,686ha) as mid-dense woody vegetation.
Of the new regrowth mapped, 70% (41,484ha) was estimated to be less than 15 years old.
Regulated vegetation management map categories
In 2020–21, about 15% (54,136ha) of the statewide clearing activity was in Category B (regulated remnant) areas. This represents a 39% decrease in clearing activity from 2019–20 (88,327ha). The Brigalow Belt (41% or 22,288ha), Mulga Lands (17% or 9,105ha) and Mitchell Grass Downs (15% or 7,901ha) bioregions had the highest areas of Category B clearing activity, similar to 2019–20. However, each of these bioregions also recorded significant decreases in Category B clearing activity (36%, 65% and 20%, respectively) from 2019–20.
Of the Category B clearing activity, 70% (37,888ha) resulted in full removal of the woody vegetation, with the remainder of the Category B clearing activity distributed between areas that were partially cleared with a major level of disturbance (11% or 6,207ha) or partially cleared with a minor level of disturbance (19% or 10,041ha). About 1% (4,701ha) of the statewide clearing activity was in Category C (high-value regrowth vegetation)—a 28% decrease from 2019–20 (6,512ha). Less than 1% (2,321ha) of the clearing activity was in areas that intersect with Category R (regrowth watercourse area)—a 5% decrease from 2019–20 (2,447ha).
Clearing activity in Category X areas accounted for 82% (288,165ha) of the total clearing activity—a 10% decrease from 2019–20 (320,952ha). Almost all this clearing activity (97% or 278,884ha) resulted in full removal of the woody vegetation. About half of the Category X clearing activity was in the Brigalow Belt bioregion (53% or 154,092ha) with a further 22% (62,861ha) occurring in the Mulga Lands bioregion. Category X areas are those that are not generally regulated by the Vegetation Management Act 1999, as identified in the Regulated vegetation management map.
Regulated vegetation management maps show the different vegetation categories that are present on a parcel of land. This information helps land managers determine the type of approval needed for vegetation clearing. The categories are as follows:
Category A—vegetation that is subject to compliance notices, offsets and voluntary declarations
Category B—remnant vegetation shown on a regional ecosystem or remnant map as an endangered regional ecosystem, an of concern regional ecosystem or a least concern regional ecosystem
Category C—high-value regrowth vegetation
Category R—regrowth watercourse area
Category X—vegetation that is not generally regulated by the vegetation management laws.
In 2020–21, about 14% (49,850ha) of the clearing activity was in areas that contained least concern regional ecosystems—a decrease of 33% from 2019–20 (74,305ha). About 3% (10,546ha) of the clearing was in areas identified as having of concern regional ecosystems—a decrease of about 52% from 2019–20 (21,748ha). Less than 1% (2,714ha) of the clearing was in areas which have endangered regional ecosystems present—44% decrease from 2019-20 (4,866ha). About 70% (1,891ha) of the clearing in areas which have endangered regional ecosystems present was in the Brigalow Belt bioregion and three-quarters (1,427ha) of this was full clearing. The remaining 82% (286,288ha) was in areas with no vegetation management class.
SLATS reporting applies the precautionary principle, with the highest vegetation management class used, regardless of the proportion present in regional ecosystem mapping. For example, where a mapped regional ecosystem contains least concern regional ecosystems as the dominant ecosystems, and an endangered regional ecosystem as subdominant, this will be reported as clearing in areas containing endangered regional ecosystems.
Clearing activity—vegetation management class
2020–21
The vegetation management class refers to the current regulated extent of a regional ecosystem. The categories are endangered, of concern and least concern. No VM class refers to areas with no vegetation management class due to no regulated vegetation being present.
Of the state’s 13 bioregions, the Brigalow Belt (52% or 180,283ha) and Mulga Lands (21% or 72,238ha) accounted for nearly three-quarters (72%) of the state’s woody vegetation clearing activity. Both bioregions recorded decreases in clearing activity (10% and 34%, respectively) from 2019–20. There has been a continued significant decline in clearing activity in the Mulga Lands between 2018–19 (284,648ha) and 2020–21.
In each of these bioregions, over 90% of the clearing activity was mapped as full clearing. Most of the clearing activity in these two bioregions was in Category X areas, accounting for 85% (154,092ha) of the clearing in the Brigalow Belt and 87% (62,861ha) in the Mulga Lands. The bioregions with the next highest levels of clearing activity were Mitchell Grass Downs (8% of statewide total or 26,671ha), Desert Uplands (8% or 26,353ha) and Southeast Queensland (7% or 24,720ha). These bioregions all recorded decreases in clearing activity (1%, 21% and 18%, respectively) from 2019–20.
Area of clearing activity in bioregions in 2020–21.
The Brigalow Belt bioregion had the greatest area of new regrowth mapped, contributing 39% (23,454ha) to the state’s total of 59,564ha. The Southeast Queensland bioregion had the next greatest area of new regrowth mapped, contributing about 20% (12,229ha) to the state’s total.
Regrowth includes new woody vegetation areas which have regrown sufficiently to be reliably added to the SLATS woody extent.
For further detailed breakdowns for each of the bioregions see further breakdowns by bioregion.
Great Barrier Reef catchments
Clearing activity in the Great Barrier Reef catchment areas accounted for 47% (164,766ha) of the state’s total clearing—a 10% decrease in clearing activity from 2019–20 (182,904ha). About 90% (148,507ha) of the clearing in reef catchments in 2020–21 resulted in the full removal of the woody vegetation.
Clearing activity in Great Barrier Reef catchments
2018–19 to 2020–21
Area of new regrowth in Great Barrier Reef catchments in 2019–20 and 2020–21.
Regrowth includes new woody vegetation areas which have regrown sufficiently to be reliably added to the SLATS woody extent. Regrowth was not reported in 2018–19.
Landcover replacement class
In 2020–21, 89% (310,339ha) of the clearing activity was attributed to the pasture landcover replacement class—a 13% decrease from 2019–20 (357,604ha). Of this, about 96% was full clearing. A further 4% (12,905ha) was attributed to forestry, with crop (5,156ha) and mine (4,736ha) each accounting for about 1% of the total clearing activity.
Clearing activity—landcover replacement class
2020–21
The landcover replacement class is determined as part of the SLATS mapping process. It provides an indication of the purpose for which the vegetation was cleared. Read more about this in SLATS methodology.
Pasture is clearing activity associated with grazing and other general agricultural land management practices—this class includes clearing for pasture, internal property tracks, fence lines or fire breaks.
Crop is clearing activity for cropping or horticulture.
Forestry is clearing activity for timber harvesting in state or privately owned native or exotic (e.g. pine) forests or plantations (where it can be reliably attributed using authoritative data or other ancillary data sources).
Mine is clearing activity for mining activities (including coal seam gas infrastructure).
Infrastructure is clearing activity for utilities such as roads, railways, water storage, pipelines and powerlines.
Settlement is clearing activity for urban development.
Other refers to partial (minor) clearing activity that is not able to be reliably attributed to a landcover replacement class due to the low level of modification associated with these clearing events.
About 67% (39,837ha) of the new regrowth mapped was attributed to the pasture landcover class, and about 24% (14,531) was attributed to forestry. A further 7% (4,041ha) was mapped as crop, mainly due to new tree-crop orchards in parts of Southeast Queensland (Burnett-Mary) and Wet Tropics (around Atherton) bioregions. Due to the difficulty of differentiating between native and non-native woody vegetation using satellite imagery, non-native woody vegetation change is also included in SLATS. This may include exotic pine plantations, orchards or invasive exotic woody weeds.
The landcover class is determined bas part of the SLATS mapping process. It provides an indication of the purpose for which the land is used where the regrowth occurs. Read more about SLATS methodology.
Pasture is new regrowth in areas associated with grazing and related land management practices.
Crop is new regrowth in woody crops and horticulture, including fodder crops and tree fruits and nuts.
Forestry is new regrowth in state or privately owned native or exotic (e.g. pine) forests or plantations (where it can be reliably attributed using authoritative data or other ancillary data sources).
Mine is new regrowth in mining areas (e.g. rehabilitation areas).
Infrastructure is new regrowth associated with utilities such as roads, railways, water storage, pipelines and powerlines.
Settlement is new regrowth in urban areas and can include gardens and parklands.
Density and age since disturbance
In 2020–21, about 91% (317,866ha) of the total clearing activity occurred in sparse and very sparse woody vegetation (i.e. vegetation with less than 50% crown cover). This is reflective of a large proportion of the state’s clearing activity occurring in rangeland ecosystems including the Brigalow Belt, Mulga Lands, Desert Uplands and Mitchell Grass Downs bioregions, which are characterised by scattered trees and shrubs, open woodlands and shrublands. A further 9% (29,851ha) of the clearing activity occurred in mid-dense woody vegetation (i.e. 50–80% crown cover). Less than 1% of the total clearing occurred in dense woody vegetation (1,669ha).
Area of clearing activity for density classes of woody vegetation.
Density classes are as follows:
Dense vegetation has a Foliage Projective Cover (FPC) of 70–100% (>80% crown cover)
Mid-dense vegetation has a FPC of 30–70% (50–80% crown cover)
Sparse vegetation has a FPC of 10–30% (20–50% crown cover)
Very sparse/isolated vegetation has a FPC of <10% (0.25–20% crown cover)
NDC (i.e. no density class) refers to small areas that have not been assigned a density class due to cloud or other contamination in the satellite imagery.
Based on estimates of woody vegetation age since disturbance (refer to note), about 52% (182,913ha) of the total clearing activity in 2020–21 occurred in vegetation greater than 15 years old, and about 86% (157,676ha) of this occurred in sparse or very sparse woody vegetation.
About 36% (125,765ha) of the total clearing activity occurred in vegetation with an age since disturbance of less than 15 years, and most of this (96% or 121,267ha) occurred in sparse or very sparse woody vegetation. About 12% (40,721ha) of the clearing activity occurred in woody vegetation where a valid age since disturbance estimate could not be determined. Most of this clearing activity occurred in sparse or very sparse woody vegetation (96% or 38,923ha).
Area of clearing activity for age since disturbance classes (refer to note).
An age since disturbance of NASD (i.e. no age since disturbance) refers to those areas where a valid age since disturbance estimate could not be determined from SLATS clearing histories and/or time-series analysis of historical satellite imagery.
Clearing activity—age since disturbance and density
2020–21
Area of clearing activity by density and age since disturbance classes.
An age since disturbance of NASD (i.e. no age since disturbance) refers to those areas where a valid age since disturbance estimate could not be determined from SLATS clearing histories and/or time-series analysis of historical satellite imagery.
Density classes are as follows:
Dense vegetation has a Foliage Projective Cover (FPC) of 70–100% (>80% crown cover)
Mid-dense vegetation has a FPC of 30–70% (50–80% crown cover)
Sparse vegetation has a FPC of 10–30% (20–50% crown cover)
Very sparse/isolated vegetation has a FPC of <10% (0.25–20% crown cover)
NDC (i.e. no density class) refers to small areas that have not been assigned a density class due to cloud or other contamination in the satellite imagery.
About 80% (47,933ha) of the regrowth mapped was categorised as sparse or very sparse woody vegetation. A further 20% (11,686ha) of the regrowth mapped was categorised as mid-dense woody vegetation and less than 1% (36ha) was in dense woody vegetation.
Of the 59,654ha of new regrowth mapped, 70% (41,484ha) was estimated to be less than 15 years old. A further 23% (13,651ha) of the new regrowth mapped was estimated to be greater than 15 years old, while the remaining 8% (4,520ha) was in areas where a valid ‘age since disturbance’ estimate could not be determined.
Most of the new regrowth (i.e. 90% or 12,318ha) is estimated to be greater than 15 years old was categorised as sparse or very sparse woody vegetation. These areas are likely to have been previously excluded from the 2018 woody extent baseline as they may not have been readily detectable in the satellite imagery used at the time and are now able to be reliably detected and mapped due to additional data in the time series or availability of other new imagery.
Area of new regrowth for density classes of woody vegetation.
Density classes are as follows:
Dense vegetation has a Foliage Projective Cover (FPC) of 70–100% (>80% crown cover)
Mid-dense vegetation has a FPC of 30–70% (50–80% crown cover)
Sparse vegetation has a FPC of 10–30% (20–50% crown cover)
Very sparse/isolated vegetation has a FPC of <10% (0.25–20% crown cover)
NDC (i.e. no density class) refers to small areas that have not been assigned a density class due to cloud or other contamination in the satellite imagery.
Area of new regrowth for age since disturbance classes (refer to note).
An age since disturbance of NASD (i.e. no age since disturbance) refers to those areas where a valid age since disturbance estimate could not be determined from SLATS clearing histories and/or time-series analysis of historical satellite imagery.
Regrowth—age since disturbance and density
2020–21
Area of new regrowth by density and age since disturbance classes.
An age since disturbance of NASD (i.e. no age since disturbance) refers to those areas where a valid age since disturbance estimate could not be determined from SLATS clearing histories and/or time-series analysis of historical satellite imagery.
Density classes are as follows:
Dense vegetation has a Foliage Projective Cover (FPC) of 70–100% (>80% crown cover)
Mid-dense vegetation has a FPC of 30–70% (50–80% crown cover)
Sparse vegetation has a FPC of 10–30% (20–50% crown cover)
Very sparse/isolated vegetation has a FPC of <10% (0.25–20% crown cover)
NDC (i.e. no density class) refers to small areas that have not been assigned a density class due to cloud or other contamination in the satellite imagery.
Note: Since the release of 2018–19 SLATS report, the methods for estimating the age since disturbance of woody vegetation have been refined and data updated. The estimates are based on time-since-cleared data derived from SLATS clearing histories, and time-series analysis of more than 30 years of Landsat satellite imagery aimed at detecting woody vegetation disturbance and regrowth. The age since disturbance estimates use the time-series information where sufficient evidence is available to assign a valid estimate of how long the woody vegetation has been regrowing following a disturbance event. These updates have resulted in the following for SLATS reporting and published data:
the 2018–19 SLATS reporting has not been revised and remains as reported
the updated age since disturbance estimates have been used in the 2019–20 SLATS reporting and this 2020–21 SLATS report
the age since disturbance spatial data available in QSpatial includes the updated estimates
the updated age estimates for all monitoring periods have been used in all relevant data files that can be accessed from this 2020–21 SLATS report.
For more information on how the age since disturbance estimates are derived, refer to the SLATS methodology. It is important to note that woody vegetation that is greater than 15 years is not always considered to be remnant or high-value regrowth, as additional criteria such as species composition and vegetation height are used to determine remnant or high-value regrowth status. This is determined by the Queensland Herbarium as part of the regional ecosystem mapping framework.
Area of clearing activity in Brigalow Belt from 2018–19 to 2020–21.
Full clearing refers to areas which have been converted from woody to non-woody (i.e. less than 10% crown cover remains).
Partial (major) are clearing areas where the woody vegetation has been significantly modified but remains woody (i.e. greater than 10% crown cover remains but more than 50% of the area has been affected by the clearing).
Partial (minor) are clearing areas where some modification of the woody vegetation has occurred, remaining woody (i.e. greater than 10% crown cover remains but less than 50% of the area has been affected by the clearing).
Area of new regrowth in Brigalow Belt from 2019–20 to 2020–21.
Regrowth are new woody vegetation areas which have regrown sufficiently to be reliably added to the SLATS woody extent. Regrowth was not reported in 2018–19.
Regulated vegetation management maps show the different vegetation categories that are present on a parcel of land. This information helps land managers determine the type of approval needed for vegetation clearing. The categories are as follows:
Category A—vegetation that is subject to compliance notices, offsets, and voluntary declarations
Category B—remnant vegetation shown on a regional ecosystem or remnant map as an endangered regional ecosystem, an of concern regional ecosystem or a least concern regional ecosystem
Category C—high-value regrowth vegetation
Category R—regrowth watercourse area
Category X—vegetation that is not generally regulated by the vegetation management laws.
The vegetation management class refers to the current regulated extent of a regional ecosystem. The categories are endangered, of concern and least concern. No VM class refers to areas with no vegetation management class due to no regulated vegetation being present.
The landcover replacement class is determined as part of the SLATS mapping process. It provides an indication of the purpose for which the vegetation was cleared. Read more about this in the SLATS methodology.
Pasture is clearing activity associated with grazing and other general agricultural land management practices—this class includes clearing for pasture, internal property tracks, fence lines or fire breaks.
Crop is clearing activity for cropping or horticulture
Forestry is clearing activity for timber harvesting in state or privately owned native or exotic (e.g. pine) forests or plantations (where it can be reliably attributed using authoritative data or other ancillary data sources).
Mine is clearing activity for mining activities (including coal seam gas infrastructure).
Infrastructure is clearing activity for utilities such as roads, railways, water storage, pipelines and powerlines.
Settlement is clearing activity for urban development.
Other refers to Partial (minor) clearing activity that is not able to be reliably attributed to a landcover replacement class due to the low level of modification associated with these clearing events.
The landcover class is determined as part of the SLATS mapping process. For new regrowth mapping it provides an indication of the purpose for which the land is used where the regrowth occurs. Read more about SLATS methodology.
Pasture is new regrowth in areas associated with grazing and related land management practices.
Crop is new regrowth in woody crops and horticulture, including fodder crops and tree fruits and nuts.
Forestry is new regrowth in state or privately owned native or exotic (e.g. pine) forests or plantations (where it can be reliably attributed using authoritative data or other ancillary data sources).
Mine is new regrowth in mining areas (e.g. rehabilitation areas).
Infrastructure is new regrowth associated with utilities such as roads, railways, water storage, pipelines and powerlines.
Settlement is new regrowth in urban areas and can include gardens and parklands.
Area of clearing activity in Brigalow Belt for density classes of woody vegetation.
Density classes are as follows:
Dense vegetation has a Foliage Projective Cover (FPC) of 70–100% (>80% crown cover)
Mid-dense vegetation has a FPC of 30–70% (50–80% crown cover)
Sparse vegetation has a FPC of 10–30% (20–50% crown cover)
Very sparse/isolated vegetation has a FPC of <10% (0.25–20% crown cover)
NDC (i.e. no density class) refers to small areas that have not been assigned a density class due to cloud or other contamination in the satellite imagery.
Clearing activity—age since disturbanceBrigalow Belt, 2020–21
Area of clearing activity in Brigalow Belt for age since disturbance classes (refer to note).
An age since disturbance of NASD (i.e. no age since disturbance) refers to those areas where a valid age since disturbance estimate could not be determined from SLATS clearing histories and/or time-series analysis of historical satellite imagery.
Clearing activity—age since disturbance and densityBrigalow Belt, 2020–21
Area of clearing activity in Brigalow Belt by density and age since disturbance classes.
An age since disturbance of NASD (i.e. no age since disturbance) refers to those areas where a valid age since disturbance estimate could not be determined from SLATS clearing histories and/or time-series analysis of historical satellite imagery.
Density classes are as follows:
Dense vegetation has a Foliage Projective Cover (FPC) of 70–100% (>80% crown cover)
Mid-dense vegetation has a FPC of 30–70% (50–80% crown cover)
Sparse vegetation has a FPC of 10–30% (20–50% crown cover)
Very sparse/isolated vegetation has a FPC of <10% (0.25–20% crown cover)
NDC (i.e. no density class) refers to small areas that have not been assigned a density class due to cloud or other contamination in the satellite imagery.
Area of new regrowth in Brigalow Belt for density classes of woody vegetation.
Density classes are as follows:
Dense vegetation has a Foliage Projective Cover (FPC) of 70–100% (>80% crown cover)
Mid-dense vegetation has a FPC of 30–70% (50–80% crown cover)
Sparse vegetation has a FPC of 10–30% (20–50% crown cover)
Very sparse/isolated vegetation has a FPC of <10% (0.25–20% crown cover)
NDC (i.e. no density class) refers to small areas that have not been assigned a density class due to cloud or other contamination in the satellite imagery.
Regrowth—age since disturbanceBrigalow Belt, 2020–21
Area of new regrowth in Brigalow Belt by density and age since disturbance classes.
An age since disturbance of NASD (i.e. no age since disturbance) refers to those areas where a valid age since disturbance estimate could not be determined from SLATS clearing histories and/or time-series analysis of historical satellite imagery.
Density classes are as follows:
Dense vegetation has a Foliage Projective Cover (FPC) of 70–100% (>80% crown cover)
Mid-dense vegetation has a FPC of 30–70% (50–80% crown cover)
Sparse vegetation has a FPC of 10–30% (20–50% crown cover)
Very sparse/isolated vegetation has a FPC of <10% (0.25–20% crown cover)
NDC (i.e. no density class) refers to small areas that have not been assigned a density class due to cloud or other contamination in the satellite imagery.
Channel Country
Clearing activityChannel Country, 2018–19 to 2020–21
Area of clearing activity in Channel Country from 2018–19 to 2020–21.
Full clearing refers to areas which have been converted from woody to non-woody (i.e. less than 10% crown cover remains).
Partial (major) are clearing areas where the woody vegetation has been significantly modified but remains woody (i.e. greater than 10% crown cover remains but more than 50% of the area has been affected by the clearing).
Partial (minor) are clearing areas where some modification of the woody vegetation has occurred, remaining woody (i.e. greater than 10% crown cover remains but less than 50% of the area has been affected by the clearing).
Area of new regrowth in Channel Country from 2019–20 to 2020–21.
Regrowth are new woody vegetation areas which have regrown sufficiently to be reliably added to the SLATS woody extent. Regrowth was not reported in 2018–19.
Regulated vegetation management maps show the different vegetation categories that are present on a parcel of land. This information helps land managers determine the type of approval needed for vegetation clearing. The categories are as follows:
Category A—vegetation that is subject to compliance notices, offsets, and voluntary declarations
Category B—remnant vegetation shown on a regional ecosystem or remnant map as an endangered regional ecosystem, an of concern regional ecosystem or a least concern regional ecosystem
Category C—high-value regrowth vegetation
Category R—regrowth watercourse area
Category X—vegetation that is not generally regulated by the vegetation management laws.
The vegetation management class refers to the current regulated extent of a regional ecosystem. The categories are endangered, of concern and least concern. No VM class refers to areas with no vegetation management class due to no regulated vegetation being present.
The landcover replacement class is determined as part of the SLATS mapping process. It provides an indication of the purpose for which the vegetation was cleared. Read more about this in the SLATS methodology.
Pasture is clearing activity associated with grazing and other general agricultural land management practices—this class includes clearing for pasture, internal property tracks, fence lines or fire breaks.
Crop is clearing activity for cropping or horticulture
Forestry is clearing activity for timber harvesting in state or privately owned native or exotic (e.g. pine) forests or plantations (where it can be reliably attributed using authoritative data or other ancillary data sources).
Mine is clearing activity for mining activities (including coal seam gas infrastructure).
Infrastructure is clearing activity for utilities such as roads, railways, water storage, pipelines and powerlines.
Settlement is clearing activity for urban development.
Other refers to Partial (minor) clearing activity that is not able to be reliably attributed to a landcover replacement class due to the low level of modification associated with these clearing events.
The landcover class is determined as part of the SLATS mapping process. For new regrowth mapping it provides an indication of the purpose for which the land is used where the regrowth occurs. Read more about SLATS methodology.
Pasture is new regrowth in areas associated with grazing and related land management practices.
Crop is new regrowth in woody crops and horticulture, including fodder crops and tree fruits and nuts.
Forestry is new regrowth in state or privately owned native or exotic (e.g. pine) forests or plantations (where it can be reliably attributed using authoritative data or other ancillary data sources).
Mine is new regrowth in mining areas (e.g. rehabilitation areas).
Infrastructure is new regrowth associated with utilities such as roads, railways, water storage, pipelines and powerlines.
Settlement is new regrowth in urban areas and can include gardens and parklands.
Area of clearing activity in Channel Country for density classes of woody vegetation.
Density classes are as follows:
Dense vegetation has a Foliage Projective Cover (FPC) of 70–100% (>80% crown cover)
Mid-dense vegetation has a FPC of 30–70% (50–80% crown cover)
Sparse vegetation has a FPC of 10–30% (20–50% crown cover)
Very sparse/isolated vegetation has a FPC of <10% (0.25–20% crown cover)
NDC (i.e. no density class) refers to small areas that have not been assigned a density class due to cloud or other contamination in the satellite imagery.
Clearing activity—age since disturbanceChannel Country, 2020–21
Area of clearing activity in Channel Country for age since disturbance classes (refer to note).
An age since disturbance of NASD (i.e. no age since disturbance) refers to those areas where a valid age since disturbance estimate could not be determined from SLATS clearing histories and/or time-series analysis of historical satellite imagery.
Clearing activity—age since disturbance and densityChannel Country, 2020–21
Area of clearing activity in Channel Country by density and age since disturbance classes.
An age since disturbance of NASD (i.e. no age since disturbance) refers to those areas where a valid age since disturbance estimate could not be determined from SLATS clearing histories and/or time-series analysis of historical satellite imagery.
Density classes are as follows:
Dense vegetation has a Foliage Projective Cover (FPC) of 70–100% (>80% crown cover)
Mid-dense vegetation has a FPC of 30–70% (50–80% crown cover)
Sparse vegetation has a FPC of 10–30% (20–50% crown cover)
Very sparse/isolated vegetation has a FPC of <10% (0.25–20% crown cover)
NDC (i.e. no density class) refers to small areas that have not been assigned a density class due to cloud or other contamination in the satellite imagery.
Area of new regrowth in Channel Country for density classes of woody vegetation.
Density classes are as follows:
Dense vegetation has a Foliage Projective Cover (FPC) of 70–100% (>80% crown cover)
Mid-dense vegetation has a FPC of 30–70% (50–80% crown cover)
Sparse vegetation has a FPC of 10–30% (20–50% crown cover)
Very sparse/isolated vegetation has a FPC of <10% (0.25–20% crown cover)
NDC (i.e. no density class) refers to small areas that have not been assigned a density class due to cloud or other contamination in the satellite imagery.
Regrowth—age since disturbanceChannel Country, 2020–21
Area of new regrowth in Channel Country by density and age since disturbance classes.
An age since disturbance of NASD (i.e. no age since disturbance) refers to those areas where a valid age since disturbance estimate could not be determined from SLATS clearing histories and/or time-series analysis of historical satellite imagery.
Density classes are as follows:
Dense vegetation has a Foliage Projective Cover (FPC) of 70–100% (>80% crown cover)
Mid-dense vegetation has a FPC of 30–70% (50–80% crown cover)
Sparse vegetation has a FPC of 10–30% (20–50% crown cover)
Very sparse/isolated vegetation has a FPC of <10% (0.25–20% crown cover)
NDC (i.e. no density class) refers to small areas that have not been assigned a density class due to cloud or other contamination in the satellite imagery.
Central Queensland Coast
Clearing activityCentral Queensland Coast, 2018–19 to 2020–21
Area of clearing activity in Central Queensland Coast from 2018–19 to 2020–21.
Full clearing refers to areas which have been converted from woody to non-woody (i.e. less than 10% crown cover remains).
Partial (major) are clearing areas where the woody vegetation has been significantly modified but remains woody (i.e. greater than 10% crown cover remains but more than 50% of the area has been affected by the clearing).
Partial (minor) are clearing areas where some modification of the woody vegetation has occurred, remaining woody (i.e. greater than 10% crown cover remains but less than 50% of the area has been affected by the clearing).
RegrowthCentral Queensland Coast, 2019–20 and 2020–21
Area of new regrowth in Central Queensland Coast from 2019–20 to 2020–21.
Regrowth are new woody vegetation areas which have regrown sufficiently to be reliably added to the SLATS woody extent. Regrowth was not reported in 2018–19.
Regulated vegetation management maps show the different vegetation categories that are present on a parcel of land. This information helps land managers determine the type of approval needed for vegetation clearing. The categories are as follows:
Category A—vegetation that is subject to compliance notices, offsets, and voluntary declarations
Category B—remnant vegetation shown on a regional ecosystem or remnant map as an endangered regional ecosystem, an of concern regional ecosystem or a least concern regional ecosystem
Category C—high-value regrowth vegetation
Category R—regrowth watercourse area
Category X—vegetation that is not generally regulated by the vegetation management laws.
The vegetation management class refers to the current regulated extent of a regional ecosystem. The categories are endangered, of concern and least concern. No VM class refers to areas with no vegetation management class due to no regulated vegetation being present.
The landcover replacement class is determined as part of the SLATS mapping process. It provides an indication of the purpose for which the vegetation was cleared. Read more about this in the SLATS methodology.
Pasture is clearing activity associated with grazing and other general agricultural land management practices—this class includes clearing for pasture, internal property tracks, fence lines or fire breaks.
Crop is clearing activity for cropping or horticulture
Forestry is clearing activity for timber harvesting in state or privately owned native or exotic (e.g. pine) forests or plantations (where it can be reliably attributed using authoritative data or other ancillary data sources).
Mine is clearing activity for mining activities (including coal seam gas infrastructure).
Infrastructure is clearing activity for utilities such as roads, railways, water storage, pipelines and powerlines.
Settlement is clearing activity for urban development.
Other refers to Partial (minor) clearing activity that is not able to be reliably attributed to a landcover replacement class due to the low level of modification associated with these clearing events.
The landcover class is determined as part of the SLATS mapping process. For new regrowth mapping it provides an indication of the purpose for which the land is used where the regrowth occurs. Read more about SLATS methodology.
Pasture is new regrowth in areas associated with grazing and related land management practices.
Crop is new regrowth in woody crops and horticulture, including fodder crops and tree fruits and nuts.
Forestry is new regrowth in state or privately owned native or exotic (e.g. pine) forests or plantations (where it can be reliably attributed using authoritative data or other ancillary data sources).
Mine is new regrowth in mining areas (e.g. rehabilitation areas).
Infrastructure is new regrowth associated with utilities such as roads, railways, water storage, pipelines and powerlines.
Settlement is new regrowth in urban areas and can include gardens and parklands.
Area of clearing activity in Central Queensland Coast for density classes of woody vegetation.
Density classes are as follows:
Dense vegetation has a Foliage Projective Cover (FPC) of 70–100% (>80% crown cover)
Mid-dense vegetation has a FPC of 30–70% (50–80% crown cover)
Sparse vegetation has a FPC of 10–30% (20–50% crown cover)
Very sparse/isolated vegetation has a FPC of <10% (0.25–20% crown cover)
NDC (i.e. no density class) refers to small areas that have not been assigned a density class due to cloud or other contamination in the satellite imagery.
Clearing activity—age since disturbanceCentral Queensland Coast, 2020–21
Area of clearing activity in Central Queensland Coast for age since disturbance classes (refer to note).
An age since disturbance of NASD (i.e. no age since disturbance) refers to those areas where a valid age since disturbance estimate could not be determined from SLATS clearing histories and/or time-series analysis of historical satellite imagery.
Clearing activity—age since disturbance and densityCentral Queensland Coast, 2020–21
Area of clearing activity in Central Queensland Coast by density and age since disturbance classes.
An age since disturbance of NASD (i.e. no age since disturbance) refers to those areas where a valid age since disturbance estimate could not be determined from SLATS clearing histories and/or time-series analysis of historical satellite imagery.
Density classes are as follows:
Dense vegetation has a Foliage Projective Cover (FPC) of 70–100% (>80% crown cover)
Mid-dense vegetation has a FPC of 30–70% (50–80% crown cover)
Sparse vegetation has a FPC of 10–30% (20–50% crown cover)
Very sparse/isolated vegetation has a FPC of <10% (0.25–20% crown cover)
NDC (i.e. no density class) refers to small areas that have not been assigned a density class due to cloud or other contamination in the satellite imagery.
Area of new regrowth in Central Queensland Coast for density classes of woody vegetation.
Density classes are as follows:
Dense vegetation has a Foliage Projective Cover (FPC) of 70–100% (>80% crown cover)
Mid-dense vegetation has a FPC of 30–70% (50–80% crown cover)
Sparse vegetation has a FPC of 10–30% (20–50% crown cover)
Very sparse/isolated vegetation has a FPC of <10% (0.25–20% crown cover)
NDC (i.e. no density class) refers to small areas that have not been assigned a density class due to cloud or other contamination in the satellite imagery.
Regrowth—age since disturbanceCentral Queensland Coast, 2020–21
Area of new regrowth in Central Queensland Coast by density and age since disturbance classes.
An age since disturbance of NASD (i.e. no age since disturbance) refers to those areas where a valid age since disturbance estimate could not be determined from SLATS clearing histories and/or time-series analysis of historical satellite imagery.
Density classes are as follows:
Dense vegetation has a Foliage Projective Cover (FPC) of 70–100% (>80% crown cover)
Mid-dense vegetation has a FPC of 30–70% (50–80% crown cover)
Sparse vegetation has a FPC of 10–30% (20–50% crown cover)
Very sparse/isolated vegetation has a FPC of <10% (0.25–20% crown cover)
NDC (i.e. no density class) refers to small areas that have not been assigned a density class due to cloud or other contamination in the satellite imagery.
Cape York Peninsula
Clearing activityCape York Peninsula, 2018–19 to 2020–21
Area of clearing activity in Cape York Peninsula from 2018–19 to 2020–21.
Full clearing refers to areas which have been converted from woody to non-woody (i.e. less than 10% crown cover remains).
Partial (major) are clearing areas where the woody vegetation has been significantly modified but remains woody (i.e. greater than 10% crown cover remains but more than 50% of the area has been affected by the clearing).
Partial (minor) are clearing areas where some modification of the woody vegetation has occurred, remaining woody (i.e. greater than 10% crown cover remains but less than 50% of the area has been affected by the clearing).
Area of new regrowth in Cape York Peninsula from 2019–20 to 2020–21.
Regrowth are new woody vegetation areas which have regrown sufficiently to be reliably added to the SLATS woody extent. Regrowth was not reported in 2018–19.
Regulated vegetation management map category
Clearing activity—regulated vegetation management map categoryCape York Peninsula, 2020–21
Regulated vegetation management maps show the different vegetation categories that are present on a parcel of land. This information helps land managers determine the type of approval needed for vegetation clearing. The categories are as follows:
Category A—vegetation that is subject to compliance notices, offsets, and voluntary declarations
Category B—remnant vegetation shown on a regional ecosystem or remnant map as an endangered regional ecosystem, an of concern regional ecosystem or a least concern regional ecosystem
Category C—high-value regrowth vegetation
Category R—regrowth watercourse area
Category X—vegetation that is not generally regulated by the vegetation management laws.
The vegetation management class refers to the current regulated extent of a regional ecosystem. The categories are endangered, of concern and least concern. No VM class refers to areas with no vegetation management class due to no regulated vegetation being present.
The landcover replacement class is determined as part of the SLATS mapping process. It provides an indication of the purpose for which the vegetation was cleared. Read more about this in the SLATS methodology.
Pasture is clearing activity associated with grazing and other general agricultural land management practices—this class includes clearing for pasture, internal property tracks, fence lines or fire breaks.
Crop is clearing activity for cropping or horticulture
Forestry is clearing activity for timber harvesting in state or privately owned native or exotic (e.g. pine) forests or plantations (where it can be reliably attributed using authoritative data or other ancillary data sources).
Mine is clearing activity for mining activities (including coal seam gas infrastructure).
Infrastructure is clearing activity for utilities such as roads, railways, water storage, pipelines and powerlines.
Settlement is clearing activity for urban development.
Other refers to Partial (minor) clearing activity that is not able to be reliably attributed to a landcover replacement class due to the low level of modification associated with these clearing events.
Regrowth—landcover classCape York Peninsula, 2020–21
The landcover class is determined as part of the SLATS mapping process. For new regrowth mapping it provides an indication of the purpose for which the land is used where the regrowth occurs. Read more about SLATS methodology.
Pasture is new regrowth in areas associated with grazing and related land management practices.
Crop is new regrowth in woody crops and horticulture, including fodder crops and tree fruits and nuts.
Forestry is new regrowth in state or privately owned native or exotic (e.g. pine) forests or plantations (where it can be reliably attributed using authoritative data or other ancillary data sources).
Mine is new regrowth in mining areas (e.g. rehabilitation areas).
Infrastructure is new regrowth associated with utilities such as roads, railways, water storage, pipelines and powerlines.
Settlement is new regrowth in urban areas and can include gardens and parklands.
Density and age since disturbance
Clearing activity—densityCape York Peninsula, 2020–21
Area of clearing activity in Cape York Peninsula for density classes of woody vegetation.
Density classes are as follows:
Dense vegetation has a Foliage Projective Cover (FPC) of 70–100% (>80% crown cover)
Mid-dense vegetation has a FPC of 30–70% (50–80% crown cover)
Sparse vegetation has a FPC of 10–30% (20–50% crown cover)
Very sparse/isolated vegetation has a FPC of <10% (0.25–20% crown cover)
NDC (i.e. no density class) refers to small areas that have not been assigned a density class due to cloud or other contamination in the satellite imagery.
Clearing activity—age since disturbanceCape York Peninsula, 2020–21
Area of clearing activity in Cape York Peninsula for age since disturbance classes (refer to note).
An age since disturbance of NASD (i.e. no age since disturbance) refers to those areas where a valid age since disturbance estimate could not be determined from SLATS clearing histories and/or time-series analysis of historical satellite imagery.
Clearing activity—age since disturbance and densityCape York Peninsula, 2020–21
Area of clearing activity in Cape York Peninsula by density and age since disturbance classes.
An age since disturbance of NASD (i.e. no age since disturbance) refers to those areas where a valid age since disturbance estimate could not be determined from SLATS clearing histories and/or time-series analysis of historical satellite imagery.
Density classes are as follows:
Dense vegetation has a Foliage Projective Cover (FPC) of 70–100% (>80% crown cover)
Mid-dense vegetation has a FPC of 30–70% (50–80% crown cover)
Sparse vegetation has a FPC of 10–30% (20–50% crown cover)
Very sparse/isolated vegetation has a FPC of <10% (0.25–20% crown cover)
NDC (i.e. no density class) refers to small areas that have not been assigned a density class due to cloud or other contamination in the satellite imagery.
Area of new regrowth in Cape York Peninsula for density classes of woody vegetation.
Density classes are as follows:
Dense vegetation has a Foliage Projective Cover (FPC) of 70–100% (>80% crown cover)
Mid-dense vegetation has a FPC of 30–70% (50–80% crown cover)
Sparse vegetation has a FPC of 10–30% (20–50% crown cover)
Very sparse/isolated vegetation has a FPC of <10% (0.25–20% crown cover)
NDC (i.e. no density class) refers to small areas that have not been assigned a density class due to cloud or other contamination in the satellite imagery.
Regrowth—age since disturbanceCape York Peninsula, 2020–21
Area of new regrowth in Cape York Peninsula by density and age since disturbance classes.
An age since disturbance of NASD (i.e. no age since disturbance) refers to those areas where a valid age since disturbance estimate could not be determined from SLATS clearing histories and/or time-series analysis of historical satellite imagery.
Density classes are as follows:
Dense vegetation has a Foliage Projective Cover (FPC) of 70–100% (>80% crown cover)
Mid-dense vegetation has a FPC of 30–70% (50–80% crown cover)
Sparse vegetation has a FPC of 10–30% (20–50% crown cover)
Very sparse/isolated vegetation has a FPC of <10% (0.25–20% crown cover)
NDC (i.e. no density class) refers to small areas that have not been assigned a density class due to cloud or other contamination in the satellite imagery.
Desert Uplands
Clearing activityDesert Uplands, 2018–19 to 2020–21
Area of clearing activity in Desert Uplands from 2018–19 to 2020–21.
Full clearing refers to areas which have been converted from woody to non-woody (i.e. less than 10% crown cover remains).
Partial (major) are clearing areas where the woody vegetation has been significantly modified but remains woody (i.e. greater than 10% crown cover remains but more than 50% of the area has been affected by the clearing).
Partial (minor) are clearing areas where some modification of the woody vegetation has occurred, remaining woody (i.e. greater than 10% crown cover remains but less than 50% of the area has been affected by the clearing).
Area of new regrowth in Desert Uplands from 2019–20 to 2020–21.
Regrowth are new woody vegetation areas which have regrown sufficiently to be reliably added to the SLATS woody extent. Regrowth was not reported in 2018–19.
Regulated vegetation management maps show the different vegetation categories that are present on a parcel of land. This information helps land managers determine the type of approval needed for vegetation clearing. The categories are as follows:
Category A—vegetation that is subject to compliance notices, offsets, and voluntary declarations
Category B—remnant vegetation shown on a regional ecosystem or remnant map as an endangered regional ecosystem, an of concern regional ecosystem or a least concern regional ecosystem
Category C—high-value regrowth vegetation
Category R—regrowth watercourse area
Category X—vegetation that is not generally regulated by the vegetation management laws.
The vegetation management class refers to the current regulated extent of a regional ecosystem. The categories are endangered, of concern and least concern. No VM class refers to areas with no vegetation management class due to no regulated vegetation being present.
The landcover replacement class is determined as part of the SLATS mapping process. It provides an indication of the purpose for which the vegetation was cleared. Read more about this in the SLATS methodology.
Pasture is clearing activity associated with grazing and other general agricultural land management practices—this class includes clearing for pasture, internal property tracks, fence lines or fire breaks.
Crop is clearing activity for cropping or horticulture
Forestry is clearing activity for timber harvesting in state or privately owned native or exotic (e.g. pine) forests or plantations (where it can be reliably attributed using authoritative data or other ancillary data sources).
Mine is clearing activity for mining activities (including coal seam gas infrastructure).
Infrastructure is clearing activity for utilities such as roads, railways, water storage, pipelines and powerlines.
Settlement is clearing activity for urban development.
Other refers to Partial (minor) clearing activity that is not able to be reliably attributed to a landcover replacement class due to the low level of modification associated with these clearing events.
The landcover class is determined as part of the SLATS mapping process. For new regrowth mapping it provides an indication of the purpose for which the land is used where the regrowth occurs. Read more about SLATS methodology.
Pasture is new regrowth in areas associated with grazing and related land management practices.
Crop is new regrowth in woody crops and horticulture, including fodder crops and tree fruits and nuts.
Forestry is new regrowth in state or privately owned native or exotic (e.g. pine) forests or plantations (where it can be reliably attributed using authoritative data or other ancillary data sources).
Mine is new regrowth in mining areas (e.g. rehabilitation areas).
Infrastructure is new regrowth associated with utilities such as roads, railways, water storage, pipelines and powerlines.
Settlement is new regrowth in urban areas and can include gardens and parklands.
Area of clearing activity in Desert Uplands for density classes of woody vegetation.
Density classes are as follows:
Dense vegetation has a Foliage Projective Cover (FPC) of 70–100% (>80% crown cover)
Mid-dense vegetation has a FPC of 30–70% (50–80% crown cover)
Sparse vegetation has a FPC of 10–30% (20–50% crown cover)
Very sparse/isolated vegetation has a FPC of <10% (0.25–20% crown cover)
NDC (i.e. no density class) refers to small areas that have not been assigned a density class due to cloud or other contamination in the satellite imagery.
Clearing activity—age since disturbanceDesert Uplands, 2020–21
Area of clearing activity in Desert Uplands for age since disturbance classes (refer to note).
An age since disturbance of NASD (i.e. no age since disturbance) refers to those areas where a valid age since disturbance estimate could not be determined from SLATS clearing histories and/or time-series analysis of historical satellite imagery.
Clearing activity—age since disturbance and densityDesert Uplands, 2020–21
Area of clearing activity in Desert Uplands by density and age since disturbance classes.
An age since disturbance of NASD (i.e. no age since disturbance) refers to those areas where a valid age since disturbance estimate could not be determined from SLATS clearing histories and/or time-series analysis of historical satellite imagery.
Density classes are as follows:
Dense vegetation has a Foliage Projective Cover (FPC) of 70–100% (>80% crown cover)
Mid-dense vegetation has a FPC of 30–70% (50–80% crown cover)
Sparse vegetation has a FPC of 10–30% (20–50% crown cover)
Very sparse/isolated vegetation has a FPC of <10% (0.25–20% crown cover)
NDC (i.e. no density class) refers to small areas that have not been assigned a density class due to cloud or other contamination in the satellite imagery.
Area of new regrowth in Desert Uplands for density classes of woody vegetation.
Density classes are as follows:
Dense vegetation has a Foliage Projective Cover (FPC) of 70–100% (>80% crown cover)
Mid-dense vegetation has a FPC of 30–70% (50–80% crown cover)
Sparse vegetation has a FPC of 10–30% (20–50% crown cover)
Very sparse/isolated vegetation has a FPC of <10% (0.25–20% crown cover)
NDC (i.e. no density class) refers to small areas that have not been assigned a density class due to cloud or other contamination in the satellite imagery.
Regrowth—age since disturbanceDesert Uplands, 2020–21
Area of new regrowth in Desert Uplands by density and age since disturbance classes.
An age since disturbance of NASD (i.e. no age since disturbance) refers to those areas where a valid age since disturbance estimate could not be determined from SLATS clearing histories and/or time-series analysis of historical satellite imagery.
Density classes are as follows:
Dense vegetation has a Foliage Projective Cover (FPC) of 70–100% (>80% crown cover)
Mid-dense vegetation has a FPC of 30–70% (50–80% crown cover)
Sparse vegetation has a FPC of 10–30% (20–50% crown cover)
Very sparse/isolated vegetation has a FPC of <10% (0.25–20% crown cover)
NDC (i.e. no density class) refers to small areas that have not been assigned a density class due to cloud or other contamination in the satellite imagery.
Einasleigh Uplands
Clearing activityEinasleigh Uplands, 2018–19 to 2020–21
Area of clearing activity in Einasleigh Uplands from 2018–19 to 2020–21.
Full clearing refers to areas which have been converted from woody to non-woody (i.e. less than 10% crown cover remains).
Partial (major) are clearing areas where the woody vegetation has been significantly modified but remains woody (i.e. greater than 10% crown cover remains but more than 50% of the area has been affected by the clearing).
Partial (minor) are clearing areas where some modification of the woody vegetation has occurred, remaining woody (i.e. greater than 10% crown cover remains but less than 50% of the area has been affected by the clearing).
Area of new regrowth in Einasleigh Uplands from 2019–20 to 2020–21.
Regrowth are new woody vegetation areas which have regrown sufficiently to be reliably added to the SLATS woody extent. Regrowth was not reported in 2018–19.
Regulated vegetation management maps show the different vegetation categories that are present on a parcel of land. This information helps land managers determine the type of approval needed for vegetation clearing. The categories are as follows:
Category A—vegetation that is subject to compliance notices, offsets, and voluntary declarations
Category B—remnant vegetation shown on a regional ecosystem or remnant map as an endangered regional ecosystem, an of concern regional ecosystem or a least concern regional ecosystem
Category C—high-value regrowth vegetation
Category R—regrowth watercourse area
Category X—vegetation that is not generally regulated by the vegetation management laws.
The vegetation management class refers to the current regulated extent of a regional ecosystem. The categories are endangered, of concern and least concern. No VM class refers to areas with no vegetation management class due to no regulated vegetation being present.
The landcover replacement class is determined as part of the SLATS mapping process. It provides an indication of the purpose for which the vegetation was cleared. Read more about this in the SLATS methodology.
Pasture is clearing activity associated with grazing and other general agricultural land management practices—this class includes clearing for pasture, internal property tracks, fence lines or fire breaks.
Crop is clearing activity for cropping or horticulture
Forestry is clearing activity for timber harvesting in state or privately owned native or exotic (e.g. pine) forests or plantations (where it can be reliably attributed using authoritative data or other ancillary data sources).
Mine is clearing activity for mining activities (including coal seam gas infrastructure).
Infrastructure is clearing activity for utilities such as roads, railways, water storage, pipelines and powerlines.
Settlement is clearing activity for urban development.
Other refers to Partial (minor) clearing activity that is not able to be reliably attributed to a landcover replacement class due to the low level of modification associated with these clearing events.
The landcover class is determined as part of the SLATS mapping process. For new regrowth mapping it provides an indication of the purpose for which the land is used where the regrowth occurs. Read more about SLATS methodology.
Pasture is new regrowth in areas associated with grazing and related land management practices.
Crop is new regrowth in woody crops and horticulture, including fodder crops and tree fruits and nuts.
Forestry is new regrowth in state or privately owned native or exotic (e.g. pine) forests or plantations (where it can be reliably attributed using authoritative data or other ancillary data sources).
Mine is new regrowth in mining areas (e.g. rehabilitation areas).
Infrastructure is new regrowth associated with utilities such as roads, railways, water storage, pipelines and powerlines.
Settlement is new regrowth in urban areas and can include gardens and parklands.
Area of clearing activity in Einasleigh Uplands for density classes of woody vegetation.
Density classes are as follows:
Dense vegetation has a Foliage Projective Cover (FPC) of 70–100% (>80% crown cover)
Mid-dense vegetation has a FPC of 30–70% (50–80% crown cover)
Sparse vegetation has a FPC of 10–30% (20–50% crown cover)
Very sparse/isolated vegetation has a FPC of <10% (0.25–20% crown cover)
NDC (i.e. no density class) refers to small areas that have not been assigned a density class due to cloud or other contamination in the satellite imagery.
Clearing activity—age since disturbanceEinasleigh Uplands, 2020–21
Area of clearing activity in Einasleigh Uplands for age since disturbance classes (refer to note).
An age since disturbance of NASD (i.e. no age since disturbance) refers to those areas where a valid age since disturbance estimate could not be determined from SLATS clearing histories and/or time-series analysis of historical satellite imagery.
Clearing activity—age since disturbance and densityEinasleigh Uplands, 2020–21
Area of clearing activity in Einasleigh Uplands by density and age since disturbance classes.
An age since disturbance of NASD (i.e. no age since disturbance) refers to those areas where a valid age since disturbance estimate could not be determined from SLATS clearing histories and/or time-series analysis of historical satellite imagery.
Density classes are as follows:
Dense vegetation has a Foliage Projective Cover (FPC) of 70–100% (>80% crown cover)
Mid-dense vegetation has a FPC of 30–70% (50–80% crown cover)
Sparse vegetation has a FPC of 10–30% (20–50% crown cover)
Very sparse/isolated vegetation has a FPC of <10% (0.25–20% crown cover)
NDC (i.e. no density class) refers to small areas that have not been assigned a density class due to cloud or other contamination in the satellite imagery.
Area of new regrowth in Einasleigh Uplands for density classes of woody vegetation.
Density classes are as follows:
Dense vegetation has a Foliage Projective Cover (FPC) of 70–100% (>80% crown cover)
Mid-dense vegetation has a FPC of 30–70% (50–80% crown cover)
Sparse vegetation has a FPC of 10–30% (20–50% crown cover)
Very sparse/isolated vegetation has a FPC of <10% (0.25–20% crown cover)
NDC (i.e. no density class) refers to small areas that have not been assigned a density class due to cloud or other contamination in the satellite imagery.
Regrowth—age since disturbanceEinasleigh Uplands, 2020–21
Area of new regrowth in Einasleigh Uplands by density and age since disturbance classes.
An age since disturbance of NASD (i.e. no age since disturbance) refers to those areas where a valid age since disturbance estimate could not be determined from SLATS clearing histories and/or time-series analysis of historical satellite imagery.
Density classes are as follows:
Dense vegetation has a Foliage Projective Cover (FPC) of 70–100% (>80% crown cover)
Mid-dense vegetation has a FPC of 30–70% (50–80% crown cover)
Sparse vegetation has a FPC of 10–30% (20–50% crown cover)
Very sparse/isolated vegetation has a FPC of <10% (0.25–20% crown cover)
NDC (i.e. no density class) refers to small areas that have not been assigned a density class due to cloud or other contamination in the satellite imagery.
Area of clearing activity in Gulf Plains from 2018–19 to 2020–21.
Full clearing refers to areas which have been converted from woody to non-woody (i.e. less than 10% crown cover remains).
Partial (major) are clearing areas where the woody vegetation has been significantly modified but remains woody (i.e. greater than 10% crown cover remains but more than 50% of the area has been affected by the clearing).
Partial (minor) are clearing areas where some modification of the woody vegetation has occurred, remaining woody (i.e. greater than 10% crown cover remains but less than 50% of the area has been affected by the clearing).
Area of new regrowth in Gulf Plains from 2019–20 to 2020–21.
Regrowth are new woody vegetation areas which have regrown sufficiently to be reliably added to the SLATS woody extent. Regrowth was not reported in 2018–19.
Regulated vegetation management maps show the different vegetation categories that are present on a parcel of land. This information helps land managers determine the type of approval needed for vegetation clearing. The categories are as follows:
Category A—vegetation that is subject to compliance notices, offsets, and voluntary declarations
Category B—remnant vegetation shown on a regional ecosystem or remnant map as an endangered regional ecosystem, an of concern regional ecosystem or a least concern regional ecosystem
Category C—high-value regrowth vegetation
Category R—regrowth watercourse area
Category X—vegetation that is not generally regulated by the vegetation management laws.
The vegetation management class refers to the current regulated extent of a regional ecosystem. The categories are endangered, of concern and least concern. No VM class refers to areas with no vegetation management class due to no regulated vegetation being present.
The landcover replacement class is determined as part of the SLATS mapping process. It provides an indication of the purpose for which the vegetation was cleared. Read more about this in the SLATS methodology.
Pasture is clearing activity associated with grazing and other general agricultural land management practices—this class includes clearing for pasture, internal property tracks, fence lines or fire breaks.
Crop is clearing activity for cropping or horticulture
Forestry is clearing activity for timber harvesting in state or privately owned native or exotic (e.g. pine) forests or plantations (where it can be reliably attributed using authoritative data or other ancillary data sources).
Mine is clearing activity for mining activities (including coal seam gas infrastructure).
Infrastructure is clearing activity for utilities such as roads, railways, water storage, pipelines and powerlines.
Settlement is clearing activity for urban development.
Other refers to Partial (minor) clearing activity that is not able to be reliably attributed to a landcover replacement class due to the low level of modification associated with these clearing events.
The landcover class is determined as part of the SLATS mapping process. For new regrowth mapping it provides an indication of the purpose for which the land is used where the regrowth occurs. Read more about SLATS methodology.
Pasture is new regrowth in areas associated with grazing and related land management practices.
Crop is new regrowth in woody crops and horticulture, including fodder crops and tree fruits and nuts.
Forestry is new regrowth in state or privately owned native or exotic (e.g. pine) forests or plantations (where it can be reliably attributed using authoritative data or other ancillary data sources).
Mine is new regrowth in mining areas (e.g. rehabilitation areas).
Infrastructure is new regrowth associated with utilities such as roads, railways, water storage, pipelines and powerlines.
Settlement is new regrowth in urban areas and can include gardens and parklands.
Area of clearing activity in Gulf Plains for density classes of woody vegetation.
Density classes are as follows:
Dense vegetation has a Foliage Projective Cover (FPC) of 70–100% (>80% crown cover)
Mid-dense vegetation has a FPC of 30–70% (50–80% crown cover)
Sparse vegetation has a FPC of 10–30% (20–50% crown cover)
Very sparse/isolated vegetation has a FPC of <10% (0.25–20% crown cover)
NDC (i.e. no density class) refers to small areas that have not been assigned a density class due to cloud or other contamination in the satellite imagery.
Clearing activity—age since disturbanceGulf Plains, 2020–21
Area of clearing activity in Gulf Plains for age since disturbance classes (refer to note).
An age since disturbance of NASD (i.e. no age since disturbance) refers to those areas where a valid age since disturbance estimate could not be determined from SLATS clearing histories and/or time-series analysis of historical satellite imagery.
Clearing activity—age since disturbance and densityGulf Plains, 2020–21
Area of clearing activity in Gulf Plains by density and age since disturbance classes.
An age since disturbance of NASD (i.e. no age since disturbance) refers to those areas where a valid age since disturbance estimate could not be determined from SLATS clearing histories and/or time-series analysis of historical satellite imagery.
Density classes are as follows:
Dense vegetation has a Foliage Projective Cover (FPC) of 70–100% (>80% crown cover)
Mid-dense vegetation has a FPC of 30–70% (50–80% crown cover)
Sparse vegetation has a FPC of 10–30% (20–50% crown cover)
Very sparse/isolated vegetation has a FPC of <10% (0.25–20% crown cover)
NDC (i.e. no density class) refers to small areas that have not been assigned a density class due to cloud or other contamination in the satellite imagery.
Area of new regrowth in Gulf Plains for density classes of woody vegetation.
Density classes are as follows:
Dense vegetation has a Foliage Projective Cover (FPC) of 70–100% (>80% crown cover)
Mid-dense vegetation has a FPC of 30–70% (50–80% crown cover)
Sparse vegetation has a FPC of 10–30% (20–50% crown cover)
Very sparse/isolated vegetation has a FPC of <10% (0.25–20% crown cover)
NDC (i.e. no density class) refers to small areas that have not been assigned a density class due to cloud or other contamination in the satellite imagery.
Regrowth—age since disturbanceGulf Plains, 2020–21
Area of new regrowth in Gulf Plains by density and age since disturbance classes.
An age since disturbance of NASD (i.e. no age since disturbance) refers to those areas where a valid age since disturbance estimate could not be determined from SLATS clearing histories and/or time-series analysis of historical satellite imagery.
Density classes are as follows:
Dense vegetation has a Foliage Projective Cover (FPC) of 70–100% (>80% crown cover)
Mid-dense vegetation has a FPC of 30–70% (50–80% crown cover)
Sparse vegetation has a FPC of 10–30% (20–50% crown cover)
Very sparse/isolated vegetation has a FPC of <10% (0.25–20% crown cover)
NDC (i.e. no density class) refers to small areas that have not been assigned a density class due to cloud or other contamination in the satellite imagery.
Mitchell Grass Downs
Clearing activityMitchell Grass Downs, 2018–19 to 2020–21
Area of clearing activity in Mitchell Grass Downs from 2018–19 to 2020–21.
Full clearing refers to areas which have been converted from woody to non-woody (i.e. less than 10% crown cover remains).
Partial (major) are clearing areas where the woody vegetation has been significantly modified but remains woody (i.e. greater than 10% crown cover remains but more than 50% of the area has been affected by the clearing).
Partial (minor) are clearing areas where some modification of the woody vegetation has occurred, remaining woody (i.e. greater than 10% crown cover remains but less than 50% of the area has been affected by the clearing).
Area of new regrowth in Mitchell Grass Downs from 2019–20 to 2020–21.
Regrowth are new woody vegetation areas which have regrown sufficiently to be reliably added to the SLATS woody extent. Regrowth was not reported in 2018–19.
Regulated vegetation management maps show the different vegetation categories that are present on a parcel of land. This information helps land managers determine the type of approval needed for vegetation clearing. The categories are as follows:
Category A—vegetation that is subject to compliance notices, offsets, and voluntary declarations
Category B—remnant vegetation shown on a regional ecosystem or remnant map as an endangered regional ecosystem, an of concern regional ecosystem or a least concern regional ecosystem
Category C—high-value regrowth vegetation
Category R—regrowth watercourse area
Category X—vegetation that is not generally regulated by the vegetation management laws.
The vegetation management class refers to the current regulated extent of a regional ecosystem. The categories are endangered, of concern and least concern. No VM class refers to areas with no vegetation management class due to no regulated vegetation being present.
The landcover replacement class is determined as part of the SLATS mapping process. It provides an indication of the purpose for which the vegetation was cleared. Read more about this in the SLATS methodology.
Pasture is clearing activity associated with grazing and other general agricultural land management practices—this class includes clearing for pasture, internal property tracks, fence lines or fire breaks.
Crop is clearing activity for cropping or horticulture
Forestry is clearing activity for timber harvesting in state or privately owned native or exotic (e.g. pine) forests or plantations (where it can be reliably attributed using authoritative data or other ancillary data sources).
Mine is clearing activity for mining activities (including coal seam gas infrastructure).
Infrastructure is clearing activity for utilities such as roads, railways, water storage, pipelines and powerlines.
Settlement is clearing activity for urban development.
Other refers to Partial (minor) clearing activity that is not able to be reliably attributed to a landcover replacement class due to the low level of modification associated with these clearing events.
The landcover class is determined as part of the SLATS mapping process. For new regrowth mapping it provides an indication of the purpose for which the land is used where the regrowth occurs. Read more about SLATS methodology.
Pasture is new regrowth in areas associated with grazing and related land management practices.
Crop is new regrowth in woody crops and horticulture, including fodder crops and tree fruits and nuts.
Forestry is new regrowth in state or privately owned native or exotic (e.g. pine) forests or plantations (where it can be reliably attributed using authoritative data or other ancillary data sources).
Mine is new regrowth in mining areas (e.g. rehabilitation areas).
Infrastructure is new regrowth associated with utilities such as roads, railways, water storage, pipelines and powerlines.
Settlement is new regrowth in urban areas and can include gardens and parklands.
Area of clearing activity in Mitchell Grass Downs for density classes of woody vegetation.
Density classes are as follows:
Dense vegetation has a Foliage Projective Cover (FPC) of 70–100% (>80% crown cover)
Mid-dense vegetation has a FPC of 30–70% (50–80% crown cover)
Sparse vegetation has a FPC of 10–30% (20–50% crown cover)
Very sparse/isolated vegetation has a FPC of <10% (0.25–20% crown cover)
NDC (i.e. no density class) refers to small areas that have not been assigned a density class due to cloud or other contamination in the satellite imagery.
Clearing activity—age since disturbanceMitchell Grass Downs, 2020–21
Area of clearing activity in Mitchell Grass Downs for age since disturbance classes (refer to note).
An age since disturbance of NASD (i.e. no age since disturbance) refers to those areas where a valid age since disturbance estimate could not be determined from SLATS clearing histories and/or time-series analysis of historical satellite imagery.
Clearing activity—age since disturbance and densityMitchell Grass Downs, 2020–21
Area of clearing activity in Mitchell Grass Downs by density and age since disturbance classes.
An age since disturbance of NASD (i.e. no age since disturbance) refers to those areas where a valid age since disturbance estimate could not be determined from SLATS clearing histories and/or time-series analysis of historical satellite imagery.
Density classes are as follows:
Dense vegetation has a Foliage Projective Cover (FPC) of 70–100% (>80% crown cover)
Mid-dense vegetation has a FPC of 30–70% (50–80% crown cover)
Sparse vegetation has a FPC of 10–30% (20–50% crown cover)
Very sparse/isolated vegetation has a FPC of <10% (0.25–20% crown cover)
NDC (i.e. no density class) refers to small areas that have not been assigned a density class due to cloud or other contamination in the satellite imagery.
Area of new regrowth in Mitchell Grass Downs for density classes of woody vegetation.
Density classes are as follows:
Dense vegetation has a Foliage Projective Cover (FPC) of 70–100% (>80% crown cover)
Mid-dense vegetation has a FPC of 30–70% (50–80% crown cover)
Sparse vegetation has a FPC of 10–30% (20–50% crown cover)
Very sparse/isolated vegetation has a FPC of <10% (0.25–20% crown cover)
NDC (i.e. no density class) refers to small areas that have not been assigned a density class due to cloud or other contamination in the satellite imagery.
Regrowth—age since disturbanceMitchell Grass Downs, 2020–21
Area of new regrowth in Mitchell Grass Downs by density and age since disturbance classes.
An age since disturbance of NASD (i.e. no age since disturbance) refers to those areas where a valid age since disturbance estimate could not be determined from SLATS clearing histories and/or time-series analysis of historical satellite imagery.
Density classes are as follows:
Dense vegetation has a Foliage Projective Cover (FPC) of 70–100% (>80% crown cover)
Mid-dense vegetation has a FPC of 30–70% (50–80% crown cover)
Sparse vegetation has a FPC of 10–30% (20–50% crown cover)
Very sparse/isolated vegetation has a FPC of <10% (0.25–20% crown cover)
NDC (i.e. no density class) refers to small areas that have not been assigned a density class due to cloud or other contamination in the satellite imagery.
Area of clearing activity in Mulga Lands from 2018–19 to 2020–21.
Full clearing refers to areas which have been converted from woody to non-woody (i.e. less than 10% crown cover remains).
Partial (major) are clearing areas where the woody vegetation has been significantly modified but remains woody (i.e. greater than 10% crown cover remains but more than 50% of the area has been affected by the clearing).
Partial (minor) are clearing areas where some modification of the woody vegetation has occurred, remaining woody (i.e. greater than 10% crown cover remains but less than 50% of the area has been affected by the clearing).
Area of new regrowth in Mulga Lands from 2019–20 to 2020–21.
Regrowth are new woody vegetation areas which have regrown sufficiently to be reliably added to the SLATS woody extent. Regrowth was not reported in 2018–19.
Regulated vegetation management maps show the different vegetation categories that are present on a parcel of land. This information helps land managers determine the type of approval needed for vegetation clearing. The categories are as follows:
Category A—vegetation that is subject to compliance notices, offsets, and voluntary declarations
Category B—remnant vegetation shown on a regional ecosystem or remnant map as an endangered regional ecosystem, an of concern regional ecosystem or a least concern regional ecosystem
Category C—high-value regrowth vegetation
Category R—regrowth watercourse area
Category X—vegetation that is not generally regulated by the vegetation management laws.
The vegetation management class refers to the current regulated extent of a regional ecosystem. The categories are endangered, of concern and least concern. No VM class refers to areas with no vegetation management class due to no regulated vegetation being present.
The landcover replacement class is determined as part of the SLATS mapping process. It provides an indication of the purpose for which the vegetation was cleared. Read more about this in the SLATS methodology.
Pasture is clearing activity associated with grazing and other general agricultural land management practices—this class includes clearing for pasture, internal property tracks, fence lines or fire breaks.
Crop is clearing activity for cropping or horticulture
Forestry is clearing activity for timber harvesting in state or privately owned native or exotic (e.g. pine) forests or plantations (where it can be reliably attributed using authoritative data or other ancillary data sources).
Mine is clearing activity for mining activities (including coal seam gas infrastructure).
Infrastructure is clearing activity for utilities such as roads, railways, water storage, pipelines and powerlines.
Settlement is clearing activity for urban development.
Other refers to Partial (minor) clearing activity that is not able to be reliably attributed to a landcover replacement class due to the low level of modification associated with these clearing events.
The landcover class is determined as part of the SLATS mapping process. For new regrowth mapping it provides an indication of the purpose for which the land is used where the regrowth occurs. Read more about SLATS methodology.
Pasture is new regrowth in areas associated with grazing and related land management practices.
Crop is new regrowth in woody crops and horticulture, including fodder crops and tree fruits and nuts.
Forestry is new regrowth in state or privately owned native or exotic (e.g. pine) forests or plantations (where it can be reliably attributed using authoritative data or other ancillary data sources).
Mine is new regrowth in mining areas (e.g. rehabilitation areas).
Infrastructure is new regrowth associated with utilities such as roads, railways, water storage, pipelines and powerlines.
Settlement is new regrowth in urban areas and can include gardens and parklands.
Area of clearing activity in Mulga Lands for density classes of woody vegetation.
Density classes are as follows:
Dense vegetation has a Foliage Projective Cover (FPC) of 70–100% (>80% crown cover)
Mid-dense vegetation has a FPC of 30–70% (50–80% crown cover)
Sparse vegetation has a FPC of 10–30% (20–50% crown cover)
Very sparse/isolated vegetation has a FPC of <10% (0.25–20% crown cover)
NDC (i.e. no density class) refers to small areas that have not been assigned a density class due to cloud or other contamination in the satellite imagery.
Clearing activity—age since disturbanceMulga Lands, 2020–21
Area of clearing activity in Mulga Lands for age since disturbance classes (refer to note).
An age since disturbance of NASD (i.e. no age since disturbance) refers to those areas where a valid age since disturbance estimate could not be determined from SLATS clearing histories and/or time-series analysis of historical satellite imagery.
Clearing activity—age since disturbance and densityMulga Lands, 2020–21
Area of clearing activity in Mulga Lands by density and age since disturbance classes.
An age since disturbance of NASD (i.e. no age since disturbance) refers to those areas where a valid age since disturbance estimate could not be determined from SLATS clearing histories and/or time-series analysis of historical satellite imagery.
Density classes are as follows:
Dense vegetation has a Foliage Projective Cover (FPC) of 70–100% (>80% crown cover)
Mid-dense vegetation has a FPC of 30–70% (50–80% crown cover)
Sparse vegetation has a FPC of 10–30% (20–50% crown cover)
Very sparse/isolated vegetation has a FPC of <10% (0.25–20% crown cover)
NDC (i.e. no density class) refers to small areas that have not been assigned a density class due to cloud or other contamination in the satellite imagery.
Area of new regrowth in Mulga Lands for density classes of woody vegetation.
Density classes are as follows:
Dense vegetation has a Foliage Projective Cover (FPC) of 70–100% (>80% crown cover)
Mid-dense vegetation has a FPC of 30–70% (50–80% crown cover)
Sparse vegetation has a FPC of 10–30% (20–50% crown cover)
Very sparse/isolated vegetation has a FPC of <10% (0.25–20% crown cover)
NDC (i.e. no density class) refers to small areas that have not been assigned a density class due to cloud or other contamination in the satellite imagery.
Regrowth—age since disturbanceMulga Lands, 2020–21
Area of new regrowth in Mulga Lands by density and age since disturbance classes.
An age since disturbance of NASD (i.e. no age since disturbance) refers to those areas where a valid age since disturbance estimate could not be determined from SLATS clearing histories and/or time-series analysis of historical satellite imagery.
Density classes are as follows:
Dense vegetation has a Foliage Projective Cover (FPC) of 70–100% (>80% crown cover)
Mid-dense vegetation has a FPC of 30–70% (50–80% crown cover)
Sparse vegetation has a FPC of 10–30% (20–50% crown cover)
Very sparse/isolated vegetation has a FPC of <10% (0.25–20% crown cover)
NDC (i.e. no density class) refers to small areas that have not been assigned a density class due to cloud or other contamination in the satellite imagery.
New England Tableland
Clearing activityNew England Tableland, 2018–19 to 2020–21
Area of clearing activity in New England Tableland from 2018–19 to 2020–21.
Full clearing refers to areas which have been converted from woody to non-woody (i.e. less than 10% crown cover remains).
Partial (major) are clearing areas where the woody vegetation has been significantly modified but remains woody (i.e. greater than 10% crown cover remains but more than 50% of the area has been affected by the clearing).
Partial (minor) are clearing areas where some modification of the woody vegetation has occurred, remaining woody (i.e. greater than 10% crown cover remains but less than 50% of the area has been affected by the clearing).
RegrowthNew England Tableland, 2019–20 and 2020–21
Area of new regrowth in New England Tableland from 2019–20 to 2020–21.
Regrowth are new woody vegetation areas which have regrown sufficiently to be reliably added to the SLATS woody extent. Regrowth was not reported in 2018–19.
Regulated vegetation management map category
Clearing activity—regulated vegetation management map categoryNew England Tableland, 2020–21
Regulated vegetation management maps show the different vegetation categories that are present on a parcel of land. This information helps land managers determine the type of approval needed for vegetation clearing. The categories are as follows:
Category A—vegetation that is subject to compliance notices, offsets, and voluntary declarations
Category B—remnant vegetation shown on a regional ecosystem or remnant map as an endangered regional ecosystem, an of concern regional ecosystem or a least concern regional ecosystem
Category C—high-value regrowth vegetation
Category R—regrowth watercourse area
Category X—vegetation that is not generally regulated by the vegetation management laws.
The vegetation management class refers to the current regulated extent of a regional ecosystem. The categories are endangered, of concern and least concern. No VM class refers to areas with no vegetation management class due to no regulated vegetation being present.
The landcover replacement class is determined as part of the SLATS mapping process. It provides an indication of the purpose for which the vegetation was cleared. Read more about this in the SLATS methodology.
Pasture is clearing activity associated with grazing and other general agricultural land management practices—this class includes clearing for pasture, internal property tracks, fence lines or fire breaks.
Crop is clearing activity for cropping or horticulture
Forestry is clearing activity for timber harvesting in state or privately owned native or exotic (e.g. pine) forests or plantations (where it can be reliably attributed using authoritative data or other ancillary data sources).
Mine is clearing activity for mining activities (including coal seam gas infrastructure).
Infrastructure is clearing activity for utilities such as roads, railways, water storage, pipelines and powerlines.
Settlement is clearing activity for urban development.
Other refers to Partial (minor) clearing activity that is not able to be reliably attributed to a landcover replacement class due to the low level of modification associated with these clearing events.
Regrowth—landcover classNew England Tableland, 2020–21
The landcover class is determined as part of the SLATS mapping process. For new regrowth mapping it provides an indication of the purpose for which the land is used where the regrowth occurs. Read more about SLATS methodology.
Pasture is new regrowth in areas associated with grazing and related land management practices.
Crop is new regrowth in woody crops and horticulture, including fodder crops and tree fruits and nuts.
Forestry is new regrowth in state or privately owned native or exotic (e.g. pine) forests or plantations (where it can be reliably attributed using authoritative data or other ancillary data sources).
Mine is new regrowth in mining areas (e.g. rehabilitation areas).
Infrastructure is new regrowth associated with utilities such as roads, railways, water storage, pipelines and powerlines.
Settlement is new regrowth in urban areas and can include gardens and parklands.
Density and age since disturbance
Clearing activity—densityNew England Tableland, 2020–21
Area of clearing activity in New England Tableland for density classes of woody vegetation.
Density classes are as follows:
Dense vegetation has a Foliage Projective Cover (FPC) of 70–100% (>80% crown cover)
Mid-dense vegetation has a FPC of 30–70% (50–80% crown cover)
Sparse vegetation has a FPC of 10–30% (20–50% crown cover)
Very sparse/isolated vegetation has a FPC of <10% (0.25–20% crown cover)
NDC (i.e. no density class) refers to small areas that have not been assigned a density class due to cloud or other contamination in the satellite imagery.
Clearing activity—age since disturbanceNew England Tableland, 2020–21
Area of clearing activity in New England Tableland for age since disturbance classes (refer to note).
An age since disturbance of NASD (i.e. no age since disturbance) refers to those areas where a valid age since disturbance estimate could not be determined from SLATS clearing histories and/or time-series analysis of historical satellite imagery.
Clearing activity—age since disturbance and densityNew England Tableland, 2020–21
Area of clearing activity in New England Tableland by density and age since disturbance classes.
An age since disturbance of NASD (i.e. no age since disturbance) refers to those areas where a valid age since disturbance estimate could not be determined from SLATS clearing histories and/or time-series analysis of historical satellite imagery.
Density classes are as follows:
Dense vegetation has a Foliage Projective Cover (FPC) of 70–100% (>80% crown cover)
Mid-dense vegetation has a FPC of 30–70% (50–80% crown cover)
Sparse vegetation has a FPC of 10–30% (20–50% crown cover)
Very sparse/isolated vegetation has a FPC of <10% (0.25–20% crown cover)
NDC (i.e. no density class) refers to small areas that have not been assigned a density class due to cloud or other contamination in the satellite imagery.
Area of new regrowth in New England Tableland for density classes of woody vegetation.
Density classes are as follows:
Dense vegetation has a Foliage Projective Cover (FPC) of 70–100% (>80% crown cover)
Mid-dense vegetation has a FPC of 30–70% (50–80% crown cover)
Sparse vegetation has a FPC of 10–30% (20–50% crown cover)
Very sparse/isolated vegetation has a FPC of <10% (0.25–20% crown cover)
NDC (i.e. no density class) refers to small areas that have not been assigned a density class due to cloud or other contamination in the satellite imagery.
Regrowth—age since disturbanceNew England Tableland, 2020–21
Area of new regrowth in New England Tableland by density and age since disturbance classes.
An age since disturbance of NASD (i.e. no age since disturbance) refers to those areas where a valid age since disturbance estimate could not be determined from SLATS clearing histories and/or time-series analysis of historical satellite imagery.
Density classes are as follows:
Dense vegetation has a Foliage Projective Cover (FPC) of 70–100% (>80% crown cover)
Mid-dense vegetation has a FPC of 30–70% (50–80% crown cover)
Sparse vegetation has a FPC of 10–30% (20–50% crown cover)
Very sparse/isolated vegetation has a FPC of <10% (0.25–20% crown cover)
NDC (i.e. no density class) refers to small areas that have not been assigned a density class due to cloud or other contamination in the satellite imagery.
Northwest Highlands
Clearing activityNorthwest Highlands, 2018–19 to 2020–21
Area of clearing activity in Northwest Highlands from 2018–19 to 2020–21.
Full clearing refers to areas which have been converted from woody to non-woody (i.e. less than 10% crown cover remains).
Partial (major) are clearing areas where the woody vegetation has been significantly modified but remains woody (i.e. greater than 10% crown cover remains but more than 50% of the area has been affected by the clearing).
Partial (minor) are clearing areas where some modification of the woody vegetation has occurred, remaining woody (i.e. greater than 10% crown cover remains but less than 50% of the area has been affected by the clearing).
Area of new regrowth in Northwest Highlands from 2019–20 to 2020–21.
Regrowth are new woody vegetation areas which have regrown sufficiently to be reliably added to the SLATS woody extent. Regrowth was not reported in 2018–19.
Regulated vegetation management maps show the different vegetation categories that are present on a parcel of land. This information helps land managers determine the type of approval needed for vegetation clearing. The categories are as follows:
Category A—vegetation that is subject to compliance notices, offsets, and voluntary declarations
Category B—remnant vegetation shown on a regional ecosystem or remnant map as an endangered regional ecosystem, an of concern regional ecosystem or a least concern regional ecosystem
Category C—high-value regrowth vegetation
Category R—regrowth watercourse area
Category X—vegetation that is not generally regulated by the vegetation management laws.
The vegetation management class refers to the current regulated extent of a regional ecosystem. The categories are endangered, of concern and least concern. No VM class refers to areas with no vegetation management class due to no regulated vegetation being present.
The landcover replacement class is determined as part of the SLATS mapping process. It provides an indication of the purpose for which the vegetation was cleared. Read more about this in the SLATS methodology.
Pasture is clearing activity associated with grazing and other general agricultural land management practices—this class includes clearing for pasture, internal property tracks, fence lines or fire breaks.
Crop is clearing activity for cropping or horticulture
Forestry is clearing activity for timber harvesting in state or privately owned native or exotic (e.g. pine) forests or plantations (where it can be reliably attributed using authoritative data or other ancillary data sources).
Mine is clearing activity for mining activities (including coal seam gas infrastructure).
Infrastructure is clearing activity for utilities such as roads, railways, water storage, pipelines and powerlines.
Settlement is clearing activity for urban development.
Other refers to Partial (minor) clearing activity that is not able to be reliably attributed to a landcover replacement class due to the low level of modification associated with these clearing events.
The landcover class is determined as part of the SLATS mapping process. For new regrowth mapping it provides an indication of the purpose for which the land is used where the regrowth occurs. Read more about SLATS methodology.
Pasture is new regrowth in areas associated with grazing and related land management practices.
Crop is new regrowth in woody crops and horticulture, including fodder crops and tree fruits and nuts.
Forestry is new regrowth in state or privately owned native or exotic (e.g. pine) forests or plantations (where it can be reliably attributed using authoritative data or other ancillary data sources).
Mine is new regrowth in mining areas (e.g. rehabilitation areas).
Infrastructure is new regrowth associated with utilities such as roads, railways, water storage, pipelines and powerlines.
Settlement is new regrowth in urban areas and can include gardens and parklands.
Area of clearing activity in Northwest Highlands for density classes of woody vegetation.
Density classes are as follows:
Dense vegetation has a Foliage Projective Cover (FPC) of 70–100% (>80% crown cover)
Mid-dense vegetation has a FPC of 30–70% (50–80% crown cover)
Sparse vegetation has a FPC of 10–30% (20–50% crown cover)
Very sparse/isolated vegetation has a FPC of <10% (0.25–20% crown cover)
NDC (i.e. no density class) refers to small areas that have not been assigned a density class due to cloud or other contamination in the satellite imagery.
Clearing activity—age since disturbanceNorthwest Highlands, 2020–21
Area of clearing activity in Northwest Highlands for age since disturbance classes (refer to note).
An age since disturbance of NASD (i.e. no age since disturbance) refers to those areas where a valid age since disturbance estimate could not be determined from SLATS clearing histories and/or time-series analysis of historical satellite imagery.
Clearing activity—age since disturbance and densityNorthwest Highlands, 2020–21
Area of clearing activity in Northwest Highlands by density and age since disturbance classes.
An age since disturbance of NASD (i.e. no age since disturbance) refers to those areas where a valid age since disturbance estimate could not be determined from SLATS clearing histories and/or time-series analysis of historical satellite imagery.
Density classes are as follows:
Dense vegetation has a Foliage Projective Cover (FPC) of 70–100% (>80% crown cover)
Mid-dense vegetation has a FPC of 30–70% (50–80% crown cover)
Sparse vegetation has a FPC of 10–30% (20–50% crown cover)
Very sparse/isolated vegetation has a FPC of <10% (0.25–20% crown cover)
NDC (i.e. no density class) refers to small areas that have not been assigned a density class due to cloud or other contamination in the satellite imagery.
Area of new regrowth in Northwest Highlands for density classes of woody vegetation.
Density classes are as follows:
Dense vegetation has a Foliage Projective Cover (FPC) of 70–100% (>80% crown cover)
Mid-dense vegetation has a FPC of 30–70% (50–80% crown cover)
Sparse vegetation has a FPC of 10–30% (20–50% crown cover)
Very sparse/isolated vegetation has a FPC of <10% (0.25–20% crown cover)
NDC (i.e. no density class) refers to small areas that have not been assigned a density class due to cloud or other contamination in the satellite imagery.
Regrowth—age since disturbanceNorthwest Highlands, 2020–21
Area of new regrowth in Northwest Highlands by density and age since disturbance classes.
An age since disturbance of NASD (i.e. no age since disturbance) refers to those areas where a valid age since disturbance estimate could not be determined from SLATS clearing histories and/or time-series analysis of historical satellite imagery.
Density classes are as follows:
Dense vegetation has a Foliage Projective Cover (FPC) of 70–100% (>80% crown cover)
Mid-dense vegetation has a FPC of 30–70% (50–80% crown cover)
Sparse vegetation has a FPC of 10–30% (20–50% crown cover)
Very sparse/isolated vegetation has a FPC of <10% (0.25–20% crown cover)
NDC (i.e. no density class) refers to small areas that have not been assigned a density class due to cloud or other contamination in the satellite imagery.
Southeast Queensland
Clearing activitySoutheast Queensland, 2018–19 to 2020–21
Area of clearing activity in Southeast Queensland from 2018–19 to 2020–21.
Full clearing refers to areas which have been converted from woody to non-woody (i.e. less than 10% crown cover remains).
Partial (major) are clearing areas where the woody vegetation has been significantly modified but remains woody (i.e. greater than 10% crown cover remains but more than 50% of the area has been affected by the clearing).
Partial (minor) are clearing areas where some modification of the woody vegetation has occurred, remaining woody (i.e. greater than 10% crown cover remains but less than 50% of the area has been affected by the clearing).
Area of new regrowth in Southeast Queensland from 2019–20 to 2020–21.
Regrowth are new woody vegetation areas which have regrown sufficiently to be reliably added to the SLATS woody extent. Regrowth was not reported in 2018–19.
Regulated vegetation management maps show the different vegetation categories that are present on a parcel of land. This information helps land managers determine the type of approval needed for vegetation clearing. The categories are as follows:
Category A—vegetation that is subject to compliance notices, offsets, and voluntary declarations
Category B—remnant vegetation shown on a regional ecosystem or remnant map as an endangered regional ecosystem, an of concern regional ecosystem or a least concern regional ecosystem
Category C—high-value regrowth vegetation
Category R—regrowth watercourse area
Category X—vegetation that is not generally regulated by the vegetation management laws.
The vegetation management class refers to the current regulated extent of a regional ecosystem. The categories are endangered, of concern and least concern. No VM class refers to areas with no vegetation management class due to no regulated vegetation being present.
The landcover replacement class is determined as part of the SLATS mapping process. It provides an indication of the purpose for which the vegetation was cleared. Read more about this in the SLATS methodology.
Pasture is clearing activity associated with grazing and other general agricultural land management practices—this class includes clearing for pasture, internal property tracks, fence lines or fire breaks.
Crop is clearing activity for cropping or horticulture
Forestry is clearing activity for timber harvesting in state or privately owned native or exotic (e.g. pine) forests or plantations (where it can be reliably attributed using authoritative data or other ancillary data sources).
Mine is clearing activity for mining activities (including coal seam gas infrastructure).
Infrastructure is clearing activity for utilities such as roads, railways, water storage, pipelines and powerlines.
Settlement is clearing activity for urban development.
Other refers to Partial (minor) clearing activity that is not able to be reliably attributed to a landcover replacement class due to the low level of modification associated with these clearing events.
The landcover class is determined as part of the SLATS mapping process. For new regrowth mapping it provides an indication of the purpose for which the land is used where the regrowth occurs. Read more about SLATS methodology.
Pasture is new regrowth in areas associated with grazing and related land management practices.
Crop is new regrowth in woody crops and horticulture, including fodder crops and tree fruits and nuts.
Forestry is new regrowth in state or privately owned native or exotic (e.g. pine) forests or plantations (where it can be reliably attributed using authoritative data or other ancillary data sources).
Mine is new regrowth in mining areas (e.g. rehabilitation areas).
Infrastructure is new regrowth associated with utilities such as roads, railways, water storage, pipelines and powerlines.
Settlement is new regrowth in urban areas and can include gardens and parklands.
Area of clearing activity in Southeast Queensland for density classes of woody vegetation.
Density classes are as follows:
Dense vegetation has a Foliage Projective Cover (FPC) of 70–100% (>80% crown cover)
Mid-dense vegetation has a FPC of 30–70% (50–80% crown cover)
Sparse vegetation has a FPC of 10–30% (20–50% crown cover)
Very sparse/isolated vegetation has a FPC of <10% (0.25–20% crown cover)
NDC (i.e. no density class) refers to small areas that have not been assigned a density class due to cloud or other contamination in the satellite imagery.
Clearing activity—age since disturbanceSoutheast Queensland, 2020–21
Area of clearing activity in Southeast Queensland for age since disturbance classes (refer to note).
An age since disturbance of NASD (i.e. no age since disturbance) refers to those areas where a valid age since disturbance estimate could not be determined from SLATS clearing histories and/or time-series analysis of historical satellite imagery.
Clearing activity—age since disturbance and densitySoutheast Queensland, 2020–21
Area of clearing activity in Southeast Queensland by density and age since disturbance classes.
An age since disturbance of NASD (i.e. no age since disturbance) refers to those areas where a valid age since disturbance estimate could not be determined from SLATS clearing histories and/or time-series analysis of historical satellite imagery.
Density classes are as follows:
Dense vegetation has a Foliage Projective Cover (FPC) of 70–100% (>80% crown cover)
Mid-dense vegetation has a FPC of 30–70% (50–80% crown cover)
Sparse vegetation has a FPC of 10–30% (20–50% crown cover)
Very sparse/isolated vegetation has a FPC of <10% (0.25–20% crown cover)
NDC (i.e. no density class) refers to small areas that have not been assigned a density class due to cloud or other contamination in the satellite imagery.
Area of new regrowth in Southeast Queensland for density classes of woody vegetation.
Density classes are as follows:
Dense vegetation has a Foliage Projective Cover (FPC) of 70–100% (>80% crown cover)
Mid-dense vegetation has a FPC of 30–70% (50–80% crown cover)
Sparse vegetation has a FPC of 10–30% (20–50% crown cover)
Very sparse/isolated vegetation has a FPC of <10% (0.25–20% crown cover)
NDC (i.e. no density class) refers to small areas that have not been assigned a density class due to cloud or other contamination in the satellite imagery.
Regrowth—age since disturbanceSoutheast Queensland, 2020–21
Area of new regrowth in Southeast Queensland by density and age since disturbance classes.
An age since disturbance of NASD (i.e. no age since disturbance) refers to those areas where a valid age since disturbance estimate could not be determined from SLATS clearing histories and/or time-series analysis of historical satellite imagery.
Density classes are as follows:
Dense vegetation has a Foliage Projective Cover (FPC) of 70–100% (>80% crown cover)
Mid-dense vegetation has a FPC of 30–70% (50–80% crown cover)
Sparse vegetation has a FPC of 10–30% (20–50% crown cover)
Very sparse/isolated vegetation has a FPC of <10% (0.25–20% crown cover)
NDC (i.e. no density class) refers to small areas that have not been assigned a density class due to cloud or other contamination in the satellite imagery.
Area of clearing activity in Wet Tropics from 2018–19 to 2020–21.
Full clearing refers to areas which have been converted from woody to non-woody (i.e. less than 10% crown cover remains).
Partial (major) are clearing areas where the woody vegetation has been significantly modified but remains woody (i.e. greater than 10% crown cover remains but more than 50% of the area has been affected by the clearing).
Partial (minor) are clearing areas where some modification of the woody vegetation has occurred, remaining woody (i.e. greater than 10% crown cover remains but less than 50% of the area has been affected by the clearing).
Area of new regrowth in Wet Tropics from 2019–20 to 2020–21.
Regrowth are new woody vegetation areas which have regrown sufficiently to be reliably added to the SLATS woody extent. Regrowth was not reported in 2018–19.
Regulated vegetation management maps show the different vegetation categories that are present on a parcel of land. This information helps land managers determine the type of approval needed for vegetation clearing. The categories are as follows:
Category A—vegetation that is subject to compliance notices, offsets, and voluntary declarations
Category B—remnant vegetation shown on a regional ecosystem or remnant map as an endangered regional ecosystem, an of concern regional ecosystem or a least concern regional ecosystem
Category C—high-value regrowth vegetation
Category R—regrowth watercourse area
Category X—vegetation that is not generally regulated by the vegetation management laws.
The vegetation management class refers to the current regulated extent of a regional ecosystem. The categories are endangered, of concern and least concern. No VM class refers to areas with no vegetation management class due to no regulated vegetation being present.
The landcover replacement class is determined as part of the SLATS mapping process. It provides an indication of the purpose for which the vegetation was cleared. Read more about this in the SLATS methodology.
Pasture is clearing activity associated with grazing and other general agricultural land management practices—this class includes clearing for pasture, internal property tracks, fence lines or fire breaks.
Crop is clearing activity for cropping or horticulture
Forestry is clearing activity for timber harvesting in state or privately owned native or exotic (e.g. pine) forests or plantations (where it can be reliably attributed using authoritative data or other ancillary data sources).
Mine is clearing activity for mining activities (including coal seam gas infrastructure).
Infrastructure is clearing activity for utilities such as roads, railways, water storage, pipelines and powerlines.
Settlement is clearing activity for urban development.
Other refers to Partial (minor) clearing activity that is not able to be reliably attributed to a landcover replacement class due to the low level of modification associated with these clearing events.
The landcover class is determined as part of the SLATS mapping process. For new regrowth mapping it provides an indication of the purpose for which the land is used where the regrowth occurs. Read more about SLATS methodology.
Pasture is new regrowth in areas associated with grazing and related land management practices.
Crop is new regrowth in woody crops and horticulture, including fodder crops and tree fruits and nuts.
Forestry is new regrowth in state or privately owned native or exotic (e.g. pine) forests or plantations (where it can be reliably attributed using authoritative data or other ancillary data sources).
Mine is new regrowth in mining areas (e.g. rehabilitation areas).
Infrastructure is new regrowth associated with utilities such as roads, railways, water storage, pipelines and powerlines.
Settlement is new regrowth in urban areas and can include gardens and parklands.
Area of clearing activity in Wet Tropics for density classes of woody vegetation.
Density classes are as follows:
Dense vegetation has a Foliage Projective Cover (FPC) of 70–100% (>80% crown cover)
Mid-dense vegetation has a FPC of 30–70% (50–80% crown cover)
Sparse vegetation has a FPC of 10–30% (20–50% crown cover)
Very sparse/isolated vegetation has a FPC of <10% (0.25–20% crown cover)
NDC (i.e. no density class) refers to small areas that have not been assigned a density class due to cloud or other contamination in the satellite imagery.
Clearing activity—age since disturbanceWet Tropics, 2020–21
Area of clearing activity in Wet Tropics for age since disturbance classes (refer to note).
An age since disturbance of NASD (i.e. no age since disturbance) refers to those areas where a valid age since disturbance estimate could not be determined from SLATS clearing histories and/or time-series analysis of historical satellite imagery.
Clearing activity—age since disturbance and densityWet Tropics, 2020–21
Area of clearing activity in Wet Tropics by density and age since disturbance classes.
An age since disturbance of NASD (i.e. no age since disturbance) refers to those areas where a valid age since disturbance estimate could not be determined from SLATS clearing histories and/or time-series analysis of historical satellite imagery.
Density classes are as follows:
Dense vegetation has a Foliage Projective Cover (FPC) of 70–100% (>80% crown cover)
Mid-dense vegetation has a FPC of 30–70% (50–80% crown cover)
Sparse vegetation has a FPC of 10–30% (20–50% crown cover)
Very sparse/isolated vegetation has a FPC of <10% (0.25–20% crown cover)
NDC (i.e. no density class) refers to small areas that have not been assigned a density class due to cloud or other contamination in the satellite imagery.
Area of new regrowth in Wet Tropics for density classes of woody vegetation.
Density classes are as follows:
Dense vegetation has a Foliage Projective Cover (FPC) of 70–100% (>80% crown cover)
Mid-dense vegetation has a FPC of 30–70% (50–80% crown cover)
Sparse vegetation has a FPC of 10–30% (20–50% crown cover)
Very sparse/isolated vegetation has a FPC of <10% (0.25–20% crown cover)
NDC (i.e. no density class) refers to small areas that have not been assigned a density class due to cloud or other contamination in the satellite imagery.
Regrowth—age since disturbanceWet Tropics, 2020–21
Area of new regrowth in Wet Tropics by density and age since disturbance classes.
An age since disturbance of NASD (i.e. no age since disturbance) refers to those areas where a valid age since disturbance estimate could not be determined from SLATS clearing histories and/or time-series analysis of historical satellite imagery.
Density classes are as follows:
Dense vegetation has a Foliage Projective Cover (FPC) of 70–100% (>80% crown cover)
Mid-dense vegetation has a FPC of 30–70% (50–80% crown cover)
Sparse vegetation has a FPC of 10–30% (20–50% crown cover)
Very sparse/isolated vegetation has a FPC of <10% (0.25–20% crown cover)
NDC (i.e. no density class) refers to small areas that have not been assigned a density class due to cloud or other contamination in the satellite imagery.
Note: Since the release of 2018–19 SLATS report, the methods for estimating the age since disturbance of woody vegetation have been refined and data updated. The estimates are based on time-since-cleared data derived from SLATS clearing histories, and time-series analysis of more than 30 years of Landsat satellite imagery aimed at detecting woody vegetation disturbance and regrowth. The age since disturbance estimates use the time-series information where sufficient evidence is available to assign a valid estimate of how long the woody vegetation has been regrowing following a disturbance event. These updates have resulted in the following for SLATS reporting and published data:
the 2018–19 SLATS reporting has not been revised and remains as reported
the updated age since disturbance estimates have been used in the 2019–20 SLATS reporting and this 2020–21 SLATS report
the age since disturbance spatial data available in QSpatial includes the updated estimates
the updated age estimates for all monitoring periods have been used in all relevant data files that can be accessed from this 2020–21 SLATS report.
For more information on how the age since disturbance estimates are derived, refer to the SLATS methodology. It is important to note that woody vegetation that is greater than 15 years is not always considered to be remnant or high-value regrowth, as additional criteria such as species composition and vegetation height are used to determine remnant or high-value regrowth status. This is determined by the Queensland Herbarium as part of the regional ecosystem mapping framework.
This document is uncontrolled when printed. Before using the information in this document you should verify the current content on https://www.qldgovau.staging-services.qld.gov.au/environment/land/management/mapping/statewide-monitoring/slats/slats-reports/2020-21-slats-report.