Caloundra wave monitoring
Limited ongoing support for original wave monitoring pages
You are viewing a legacy version of our wave monitoring pages. These pages will remain available in the future, but with limited support. Wave buoy alerts will only be displayed in emergency situations. Switch to the new version.
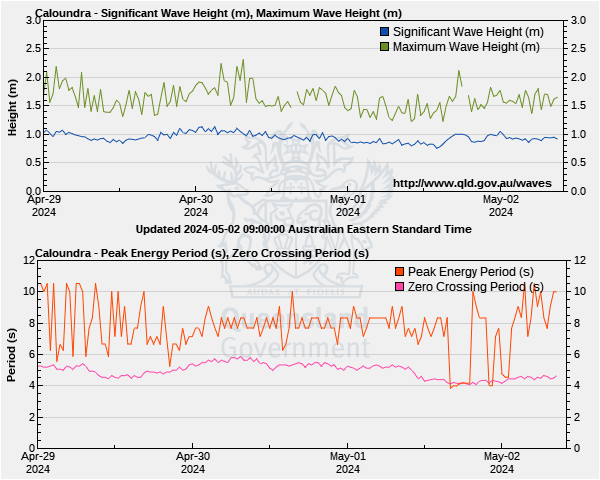
Wave height
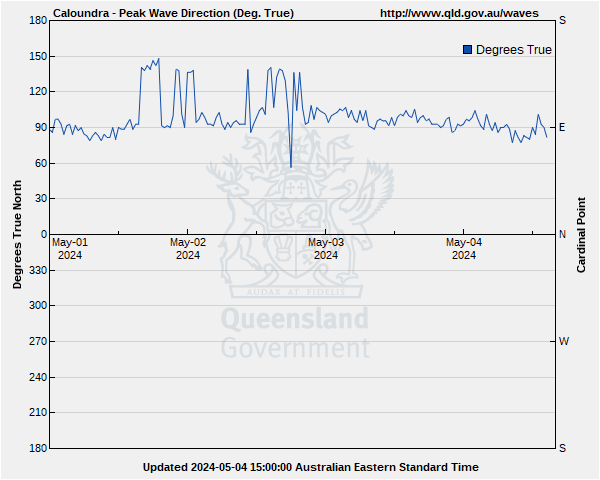
Wave direction
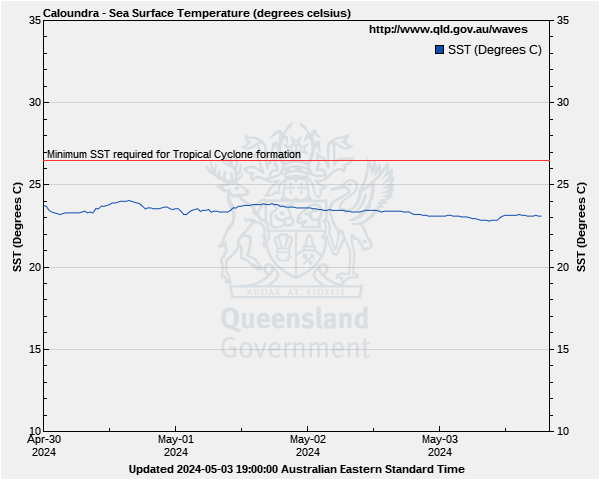
Sea surface temperature
Top ten waves from this site
| Rank | Date and time | Hmax |
|---|---|---|
| 1 | 01-05-2015 5:00pm | 7.5 |
| 2 | 30-03-2017 6:30pm | 7.0 |
| 3 | 04-06-2016 10:00am | 6.7 |
| 4 | 19-02-2015 7:30am | 6.2 |
| 5 | 14-12-2020 2:30am | 6.0 |
| 6 | 22-02-2019 7:00pm | 5.5 |
| 7 | 16-10-2018 12:00am | 5.5 |
| 8 | 16-10-2017 2:30pm | 5.4 |
| 9 | 02-01-2022 11:30am | 5.2 |
| 10 | 24-02-2022 10:00pm | 5.1 |
Wave monitoring disclaimer
These pages copyright ©2026 Queensland Government (Department of Environment, Science and Innovation).
The materials presented on this web site are distributed by the Queensland Government as an information source only.
While reasonable care and attention has been exercised in the collection and processing of this data it must be treated as unverified.
The State of Queensland makes no statements, representations or warranties about the accuracy or completeness of, and you should not rely on, any information contained on this web site. The State of Queensland disclaims all responsibility for information contained on this web site and all liability (including without limitation, liability in negligence) for all expenses, losses, damages and costs you may incur as a result of the information being inaccurate or incomplete in any way for any reason.
You should always check with the Bureau of Meteorology for the latest weather and coastal waters forecasts for your area before putting to sea.
![[Open Data]](https://www.data.qld.gov.au/base/images/od_80x15_blue.png)