Electric vehicle snapshot September 2025
Low and zero emission vehicles registered in Queensland
As at 30 September 2025.
Note: The way that registration data is presented in the electric vehicle snapshot may change each quarter due to the point in time of when the data is filtered and processed. Please see the latest published electric vehicle snapshot for the most up to date data.
Zero emission vehicles include battery electric vehicles (BEVs) while low emission vehicles include hybrids and plug-in hybrid election vehicles (PHEVs).
As of 30 September 2025:
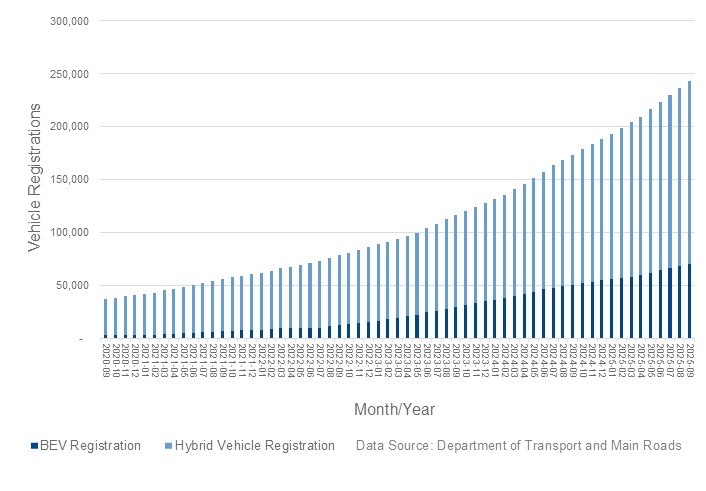
- the total registered zero emission vehicles (BEVs) in Queensland was 70,257, with a total vehicle fleet penetration of 1.4%
- the total registered low emission vehicles (hybrids and PHEVs) in Queensland was 173,038, with a total vehicle fleet penetration of 3.5%.
The type of vehicles included in registered low and zero emission vehicles, and the total vehicle fleet are passenger cars, light vans, motorcycles, buses and trucks. Registration data includes private ownership, commercial fleet, and commercial dealership registrations.
This graph shows the number of low and zero emission vehicles registered (include passenger cars, light vans, motorcycles, buses and trucks) in Queensland from September 2020 to September 2025.
| Month | Number of zero emission vehicles (BEVs) registered | Number of low emission vehicles (hybrids and PHEVs) registered |
|---|---|---|
| September 2020 | 3,193 | 33,899 |
| October 2020 | 3,282 | 35,125 |
| November 2020 | 3,336 | 36,544 |
| December 2020 | 3,606 | 37,700 |
| January 2021 | 3,682 | 38,588 |
| February 2021 | 3,746 | 39,672 |
| March 2021 | 4,267 | 41,096 |
| April 2021 | 4,348 | 42,678 |
| May 2021 | 4,753 | 44,250 |
| June 2021 | 5,295 | 45,583 |
| July 2021 | 5,720 | 46,765 |
| August 2021 | 6,169 | 48,118 |
| September 2021 | 6,825 | 49,646 |
| October 2021 | 7,160 | 50,491 |
| November 2021 | 7,594 | 51,440 |
| December 2021 | 8,076 | 52,700 |
| January 2022 | 8,232 | 53,605 |
| February 2022 | 8,697 | 55,455 |
| March 2022 | 9,535 | 56,820 |
| April 2022 | 9,724 | 58,251 |
| May 2022 | 9,959 | 59,855 |
| June 2022 | 10,180 | 61,376 |
| July 2022 | 10,333 | 62,820 |
| August 2022 | 11,385 | 64,533 |
| September 2022 | 12,997 | 65,745 |
| October 2022 | 13,720 | 67,251 |
| November 2022 | 14,328 | 69,135 |
| December 2022 | 15,325 | 70,803 |
| January 2023 | 16,872 | 72,116 |
| February 2023 | 18,040 | 73,347 |
| March 2023 | 19,521 | 74,752 |
| April 2023 | 21,164 | 76,077 |
| May 2023 | 22,421 | 77,371 |
| June 2023 | 24,606 | 79,628 |
| July 2023 | 25,899 | 82,159 |
| August 2023 | 28,288 | 84,644 |
| September 2023 | 30,061 | 86,504 |
| October 2023 | 31,231 | 88,789 |
| November 2023 | 33,488 | 91,054 |
| December 2023 | 35,047 | 93,178 |
| January 2024 | 36,413 | 95,078 |
| February 2024 | 38,335 | 97,606 |
| March 2024 | 40,528 | 100,742 |
| April 2024 | 41,920 | 104,486 |
| May 2024 | 44,156 | 107,803 |
| June 2024 | 46,323 | 111,202 |
| July 2024 | 47,990 | 115,562 |
| August 2024 | 49,445 | 119,519 |
| September 2024 | 50,688 | 123,058 |
| October 2024 | 52,158 | 126,714 |
| November 2024 | 53,467 | 130,160 |
| December 2024 | 54,968 | 133,488 |
| January 2025 | 55,879 | 137,488 |
| February 2025 | 57,080 | 141,607 |
| March 2025 | 58,528 | 146,248 |
| April 2025 | 59,823 | 149,855 |
| May 2025 | 62,048 | 154,296 |
| June 2025 | 64,684 | 159,145 |
| July 2025 | 66,253 | 163,977 |
| August 2025 | 68,165 | 168,359 |
| September 2025 | 70,257 | 173,038 |
Local Government Areas (LGA) with most total Battery Electric Vehicles (BEVs) registered as at 30 September 2025
| Local Government Area | Percentage of BEVs in the total vehicle fleet |
|---|---|
| Brisbane | 44% |
| Gold Coast | 15% |
| Moreton Bay | 8% |
| Sunshine Coast | 7% |
| Logan | 6% |
| Ipswich | 4% |
| Redland | 3% |
| Townsville | 2% |
| Cairns | 2% |
| Toowoomba | 2% |
| All other | 8% |
Note: these values are rounded to whole numbers and may not total to 100%. Registered BEVs include passenger cars, light vans, motorcycles, buses and trucks.
Data source: Department of Transport and Main Roads
Battery Electric Vehicle models registered in Queensland
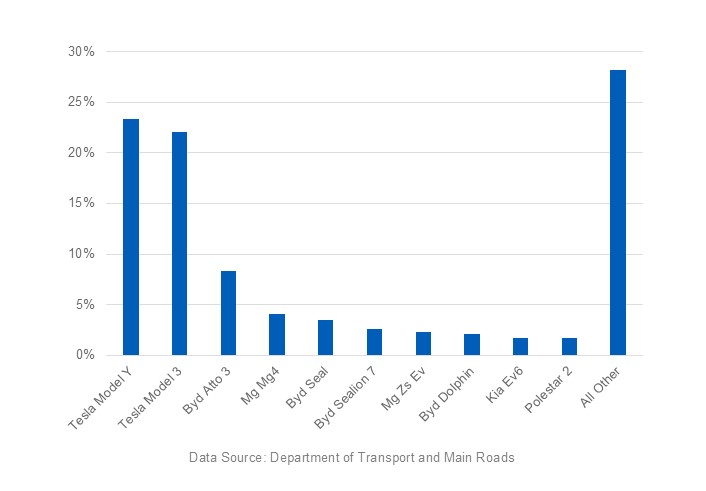
This graph shows the percentage of battery electric vehicle models (passenger vehicles) registered in Queensland as of 30 September 2025.
Model | Percentage registered* |
|---|---|
Tesla Model Y | 23% |
Tesla Model 3 | 22% |
BYD Atto 3 | 8% |
MG 4 | 4% |
BYD Seal | 3% |
BYD Sealion 7 | 3% |
MG ZS Ev | 2% |
BYD Dolphin | 2% |
| Kia EV6 | 2% |
| Polestar 2 | 2% |
All others | 28% |
* Please note: these values are rounded to whole numbers and may not total to 100%.
Queensland Electric Super Highway
Yurika, a subsidiary of Energy Queensland, own and operate all charging stations along the Queensland Electric Super Highway (QESH).
From the December 2025 quarter onwards, the usage data of QESH charging stations will no longer be reported on the Electric Vehicle Snapshot. For queries about the QESH, please contact Yurika by email at qesh@yurika.com.au or by telephone on 1300 792 611.
Usage
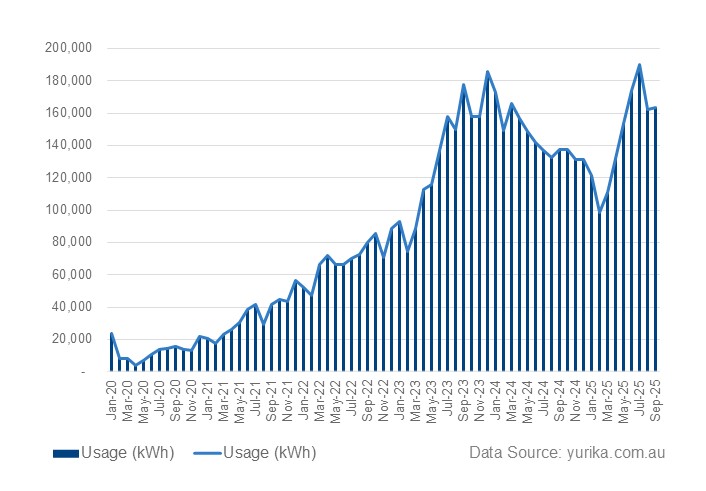
Data source: yurika.com.au
This graph shows the number of kilowatt-hours used along the Queensland Electric Super Highway from June 2020 to September 2025.
| Month | kWh |
|---|---|
| September 2020 | 15,934 |
| October 2020 | 13,812 |
| November 2020 | 13,261 |
| December 2020 | 21,900 |
| January 2021 | 20,418 |
| February 2021 | 17,771 |
| March 2021 | 23,149 |
| April 2021 | 26,075 |
| May 2021 | 30,363 |
| June 2021 | 38,248 |
| July 2021 | 41,802 |
| August 2021 | 29,542 |
| September 2021 | 41,509 |
| October 2021 | 44,523 |
| November 2021 | 43,312 |
| December 2021 | 56,499 |
| January 2022 | 52,260 |
| February 2022 | 47,404 |
| March 2022 | 66,613 |
| April 2022 | 71,779 |
| May 2022 | 66,673 |
| June 2022 | 66,342 |
| July 2022 | 69,775 |
| August 2022 | 72,338 |
| September 2022 | 79,873 |
| October 2022 | 85,824 |
| November 2022 | 70,977 |
| December 2022 | 88,438 |
| January 2023 | 92,789 |
| February 2023 | 74,313 |
| March 2023 | 88,735 |
| April 2023 | 112,981 |
| May 2023 | 115,813 |
| June 2023 | 136,610 |
| July 2023 | 157,677 |
| August 2023 | 149,896 |
| September 2023 | 177,399 |
| October 2023 | 157,651 |
| November 2023 | 157,877 |
| December 2023 | 185,759 |
| January 2024 | 172,954 |
| February 2024 | 149,093 |
| March 2024 | 165,601 |
| April 2024 | 156,388 |
| May 2024 | 148,579 |
| June 2024 | 141,680 |
| July 2024 | 137,063 |
| August 2024 | 132,803 |
| September 2024 | 137,284 |
| October 2024 | 137,477 |
| November 2024 | 131,010 |
| December 2024 | 131,432 |
| January 2025 | 121,552 |
| February 2025 | 98,766 |
| March 2025 | 111,163 |
| April 2025 | 132,012 |
| May 2025 | 153,773 |
| June 2025 | 173,737 |
| July 2025 | 189,927 |
| August 2025 | 162,376 |
| September 2025 | 163,251 |
Most popular fast-charging stations (since the opening of the QESH in 2017 to 30 September 2025)
| Suburb | Sessions | kWh usage | Percentage |
|---|---|---|---|
| Hamilton | 30,983 | 706,905 | 11 |
| North Lakes | 20,192 | 432,655 | 7 |
| Helensvale | 19,009 | 423,241 | 7 |
| Springfield | 16,889 | 387,891 | 6 |
| Gold Coast Airport (Coolangatta) | 22,211 | 382,178 | 6 |
| Slacks Creek | 17,493 | 374,025 | 6 |
| Cairns | 14,180 | 306,594 | 5 |
| All others | 151,933 | 3,253,605 | 52 |
| Total | 292,890 | 6,267,095 | 100 |
Note: these values are rounded to whole numbers and may not total to 100%.
Charging costs
On 30 June 2024, the charging rate for 50kW and 75kW chargers at Queensland Electric Super Highway sites increased from 30 cents per kilowatt-hour to 55 cents per kilowatt-hour, with the current fee for 22kW chargers maintained at 30 cents per kilowatt.
Kilometres charged
Since the inception of the QESH in 2017, the QESH have delivered a total of 34.47 million km charged, equivalent to driving around Australia 2,377 times. Based on an estimated distance of 14,500km to drive around Australia and 1kWh equating to 5–6km travelled.