Skip to main content Skip to main navigation
qld.gov.au Queensland Government
Find services Business Queensland Government employees Contact us
Queensland Government
Popular services
  • Renew vehicle or boat rego
  • Check my licence demerit points
  • Renew my driving licence
  • Change my address
Browse by category
  • Transport and motoring
  • Employment and jobs
  • Education and training
  • Queensland and its government
Browse all categories
Menu
  • Home
  • Menu
    • Aboriginal and Torres Strait Islander peoples
    • Community support
    • Education
    • Emergency services and safety
    • Jobs and work
    • Environment, land and water
    • Health
    • Housing
    • Parents and families
    • People with disability
    • Queensland's government
    • Recreation, sport and arts
    • Seniors
    • Transport
    • Your rights, crime and the law
    • Youth
  • Find services
  • Business Queensland
  • Government employees
  • Contact us
  1. Environment, land and water
  2. Plants and animals
  3. Plants
  4. Regional ecosystems
  5. Remnant regional ecosystem vegetation in Queensland
  6. Maps and statistical data by subregion

Remnant regional ecosystem vegetation in Queensland

  • Maps and statistical data by subregion
  • Maps and statistical data by catchment
  • Maps and statistical data by natural resource management area
  • Maps and statistical data by local government area
  • Maps and statistical data by electoral district

Maps and statistical data by subregion

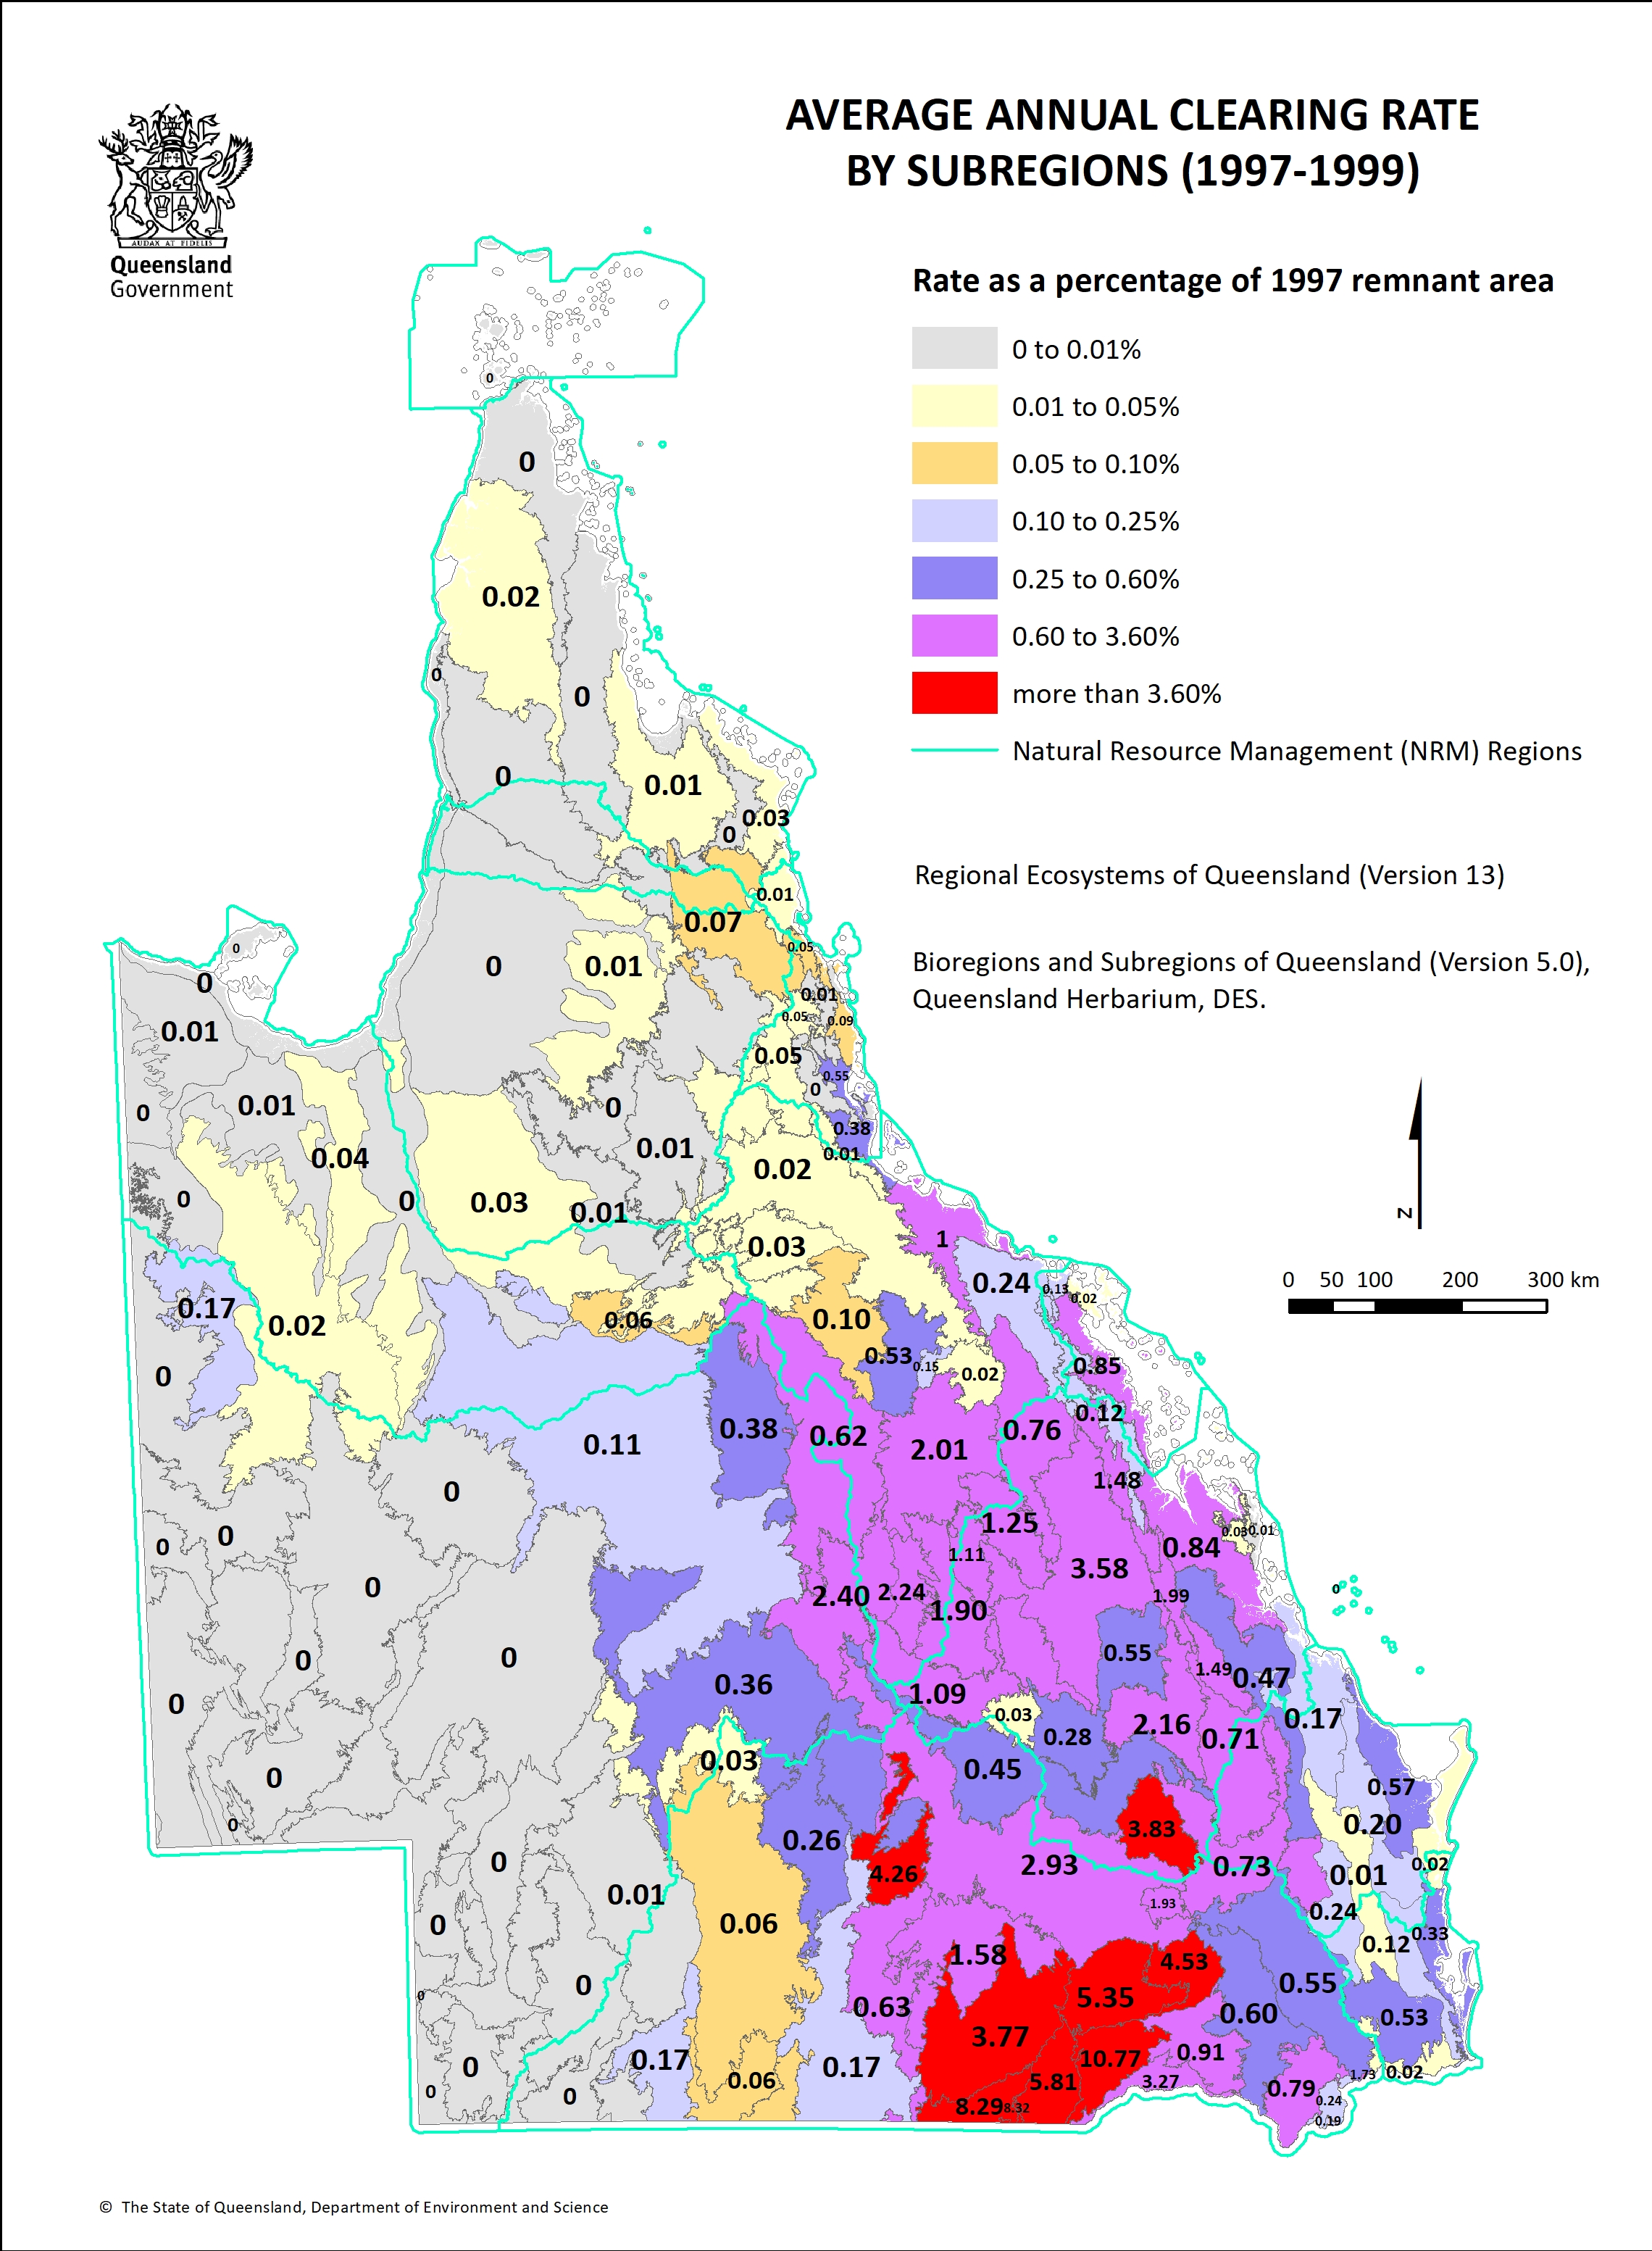
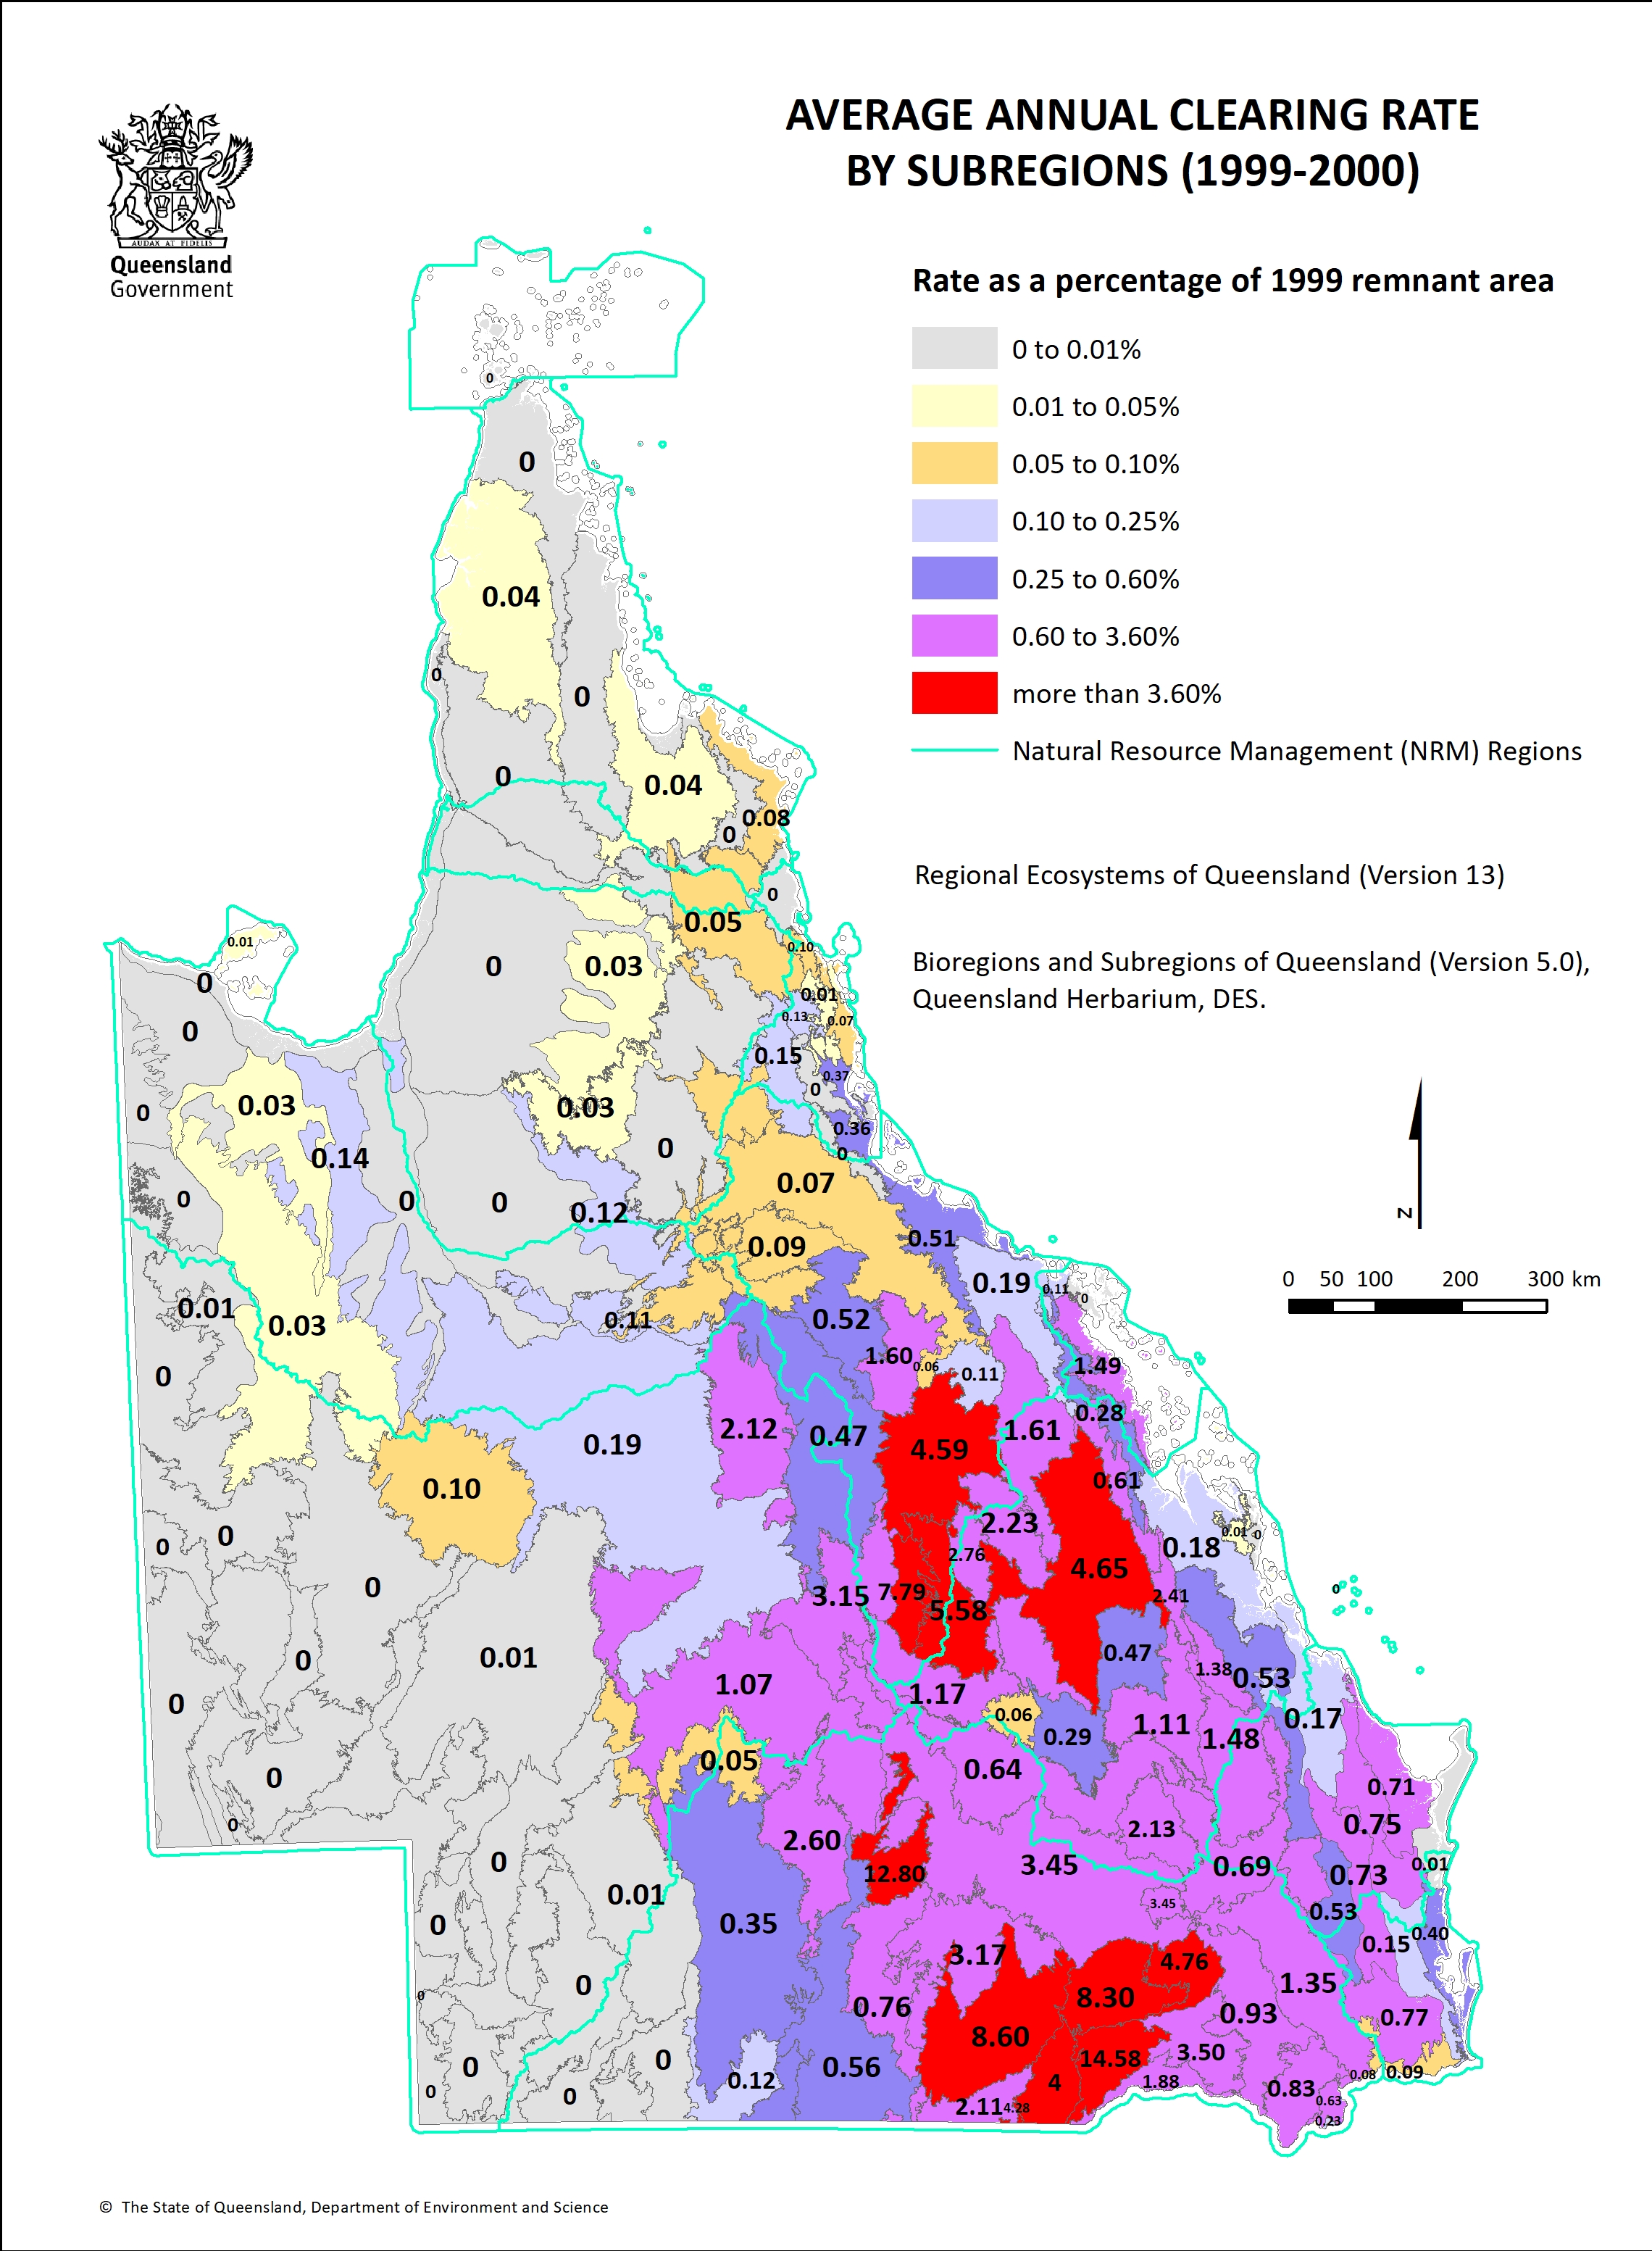
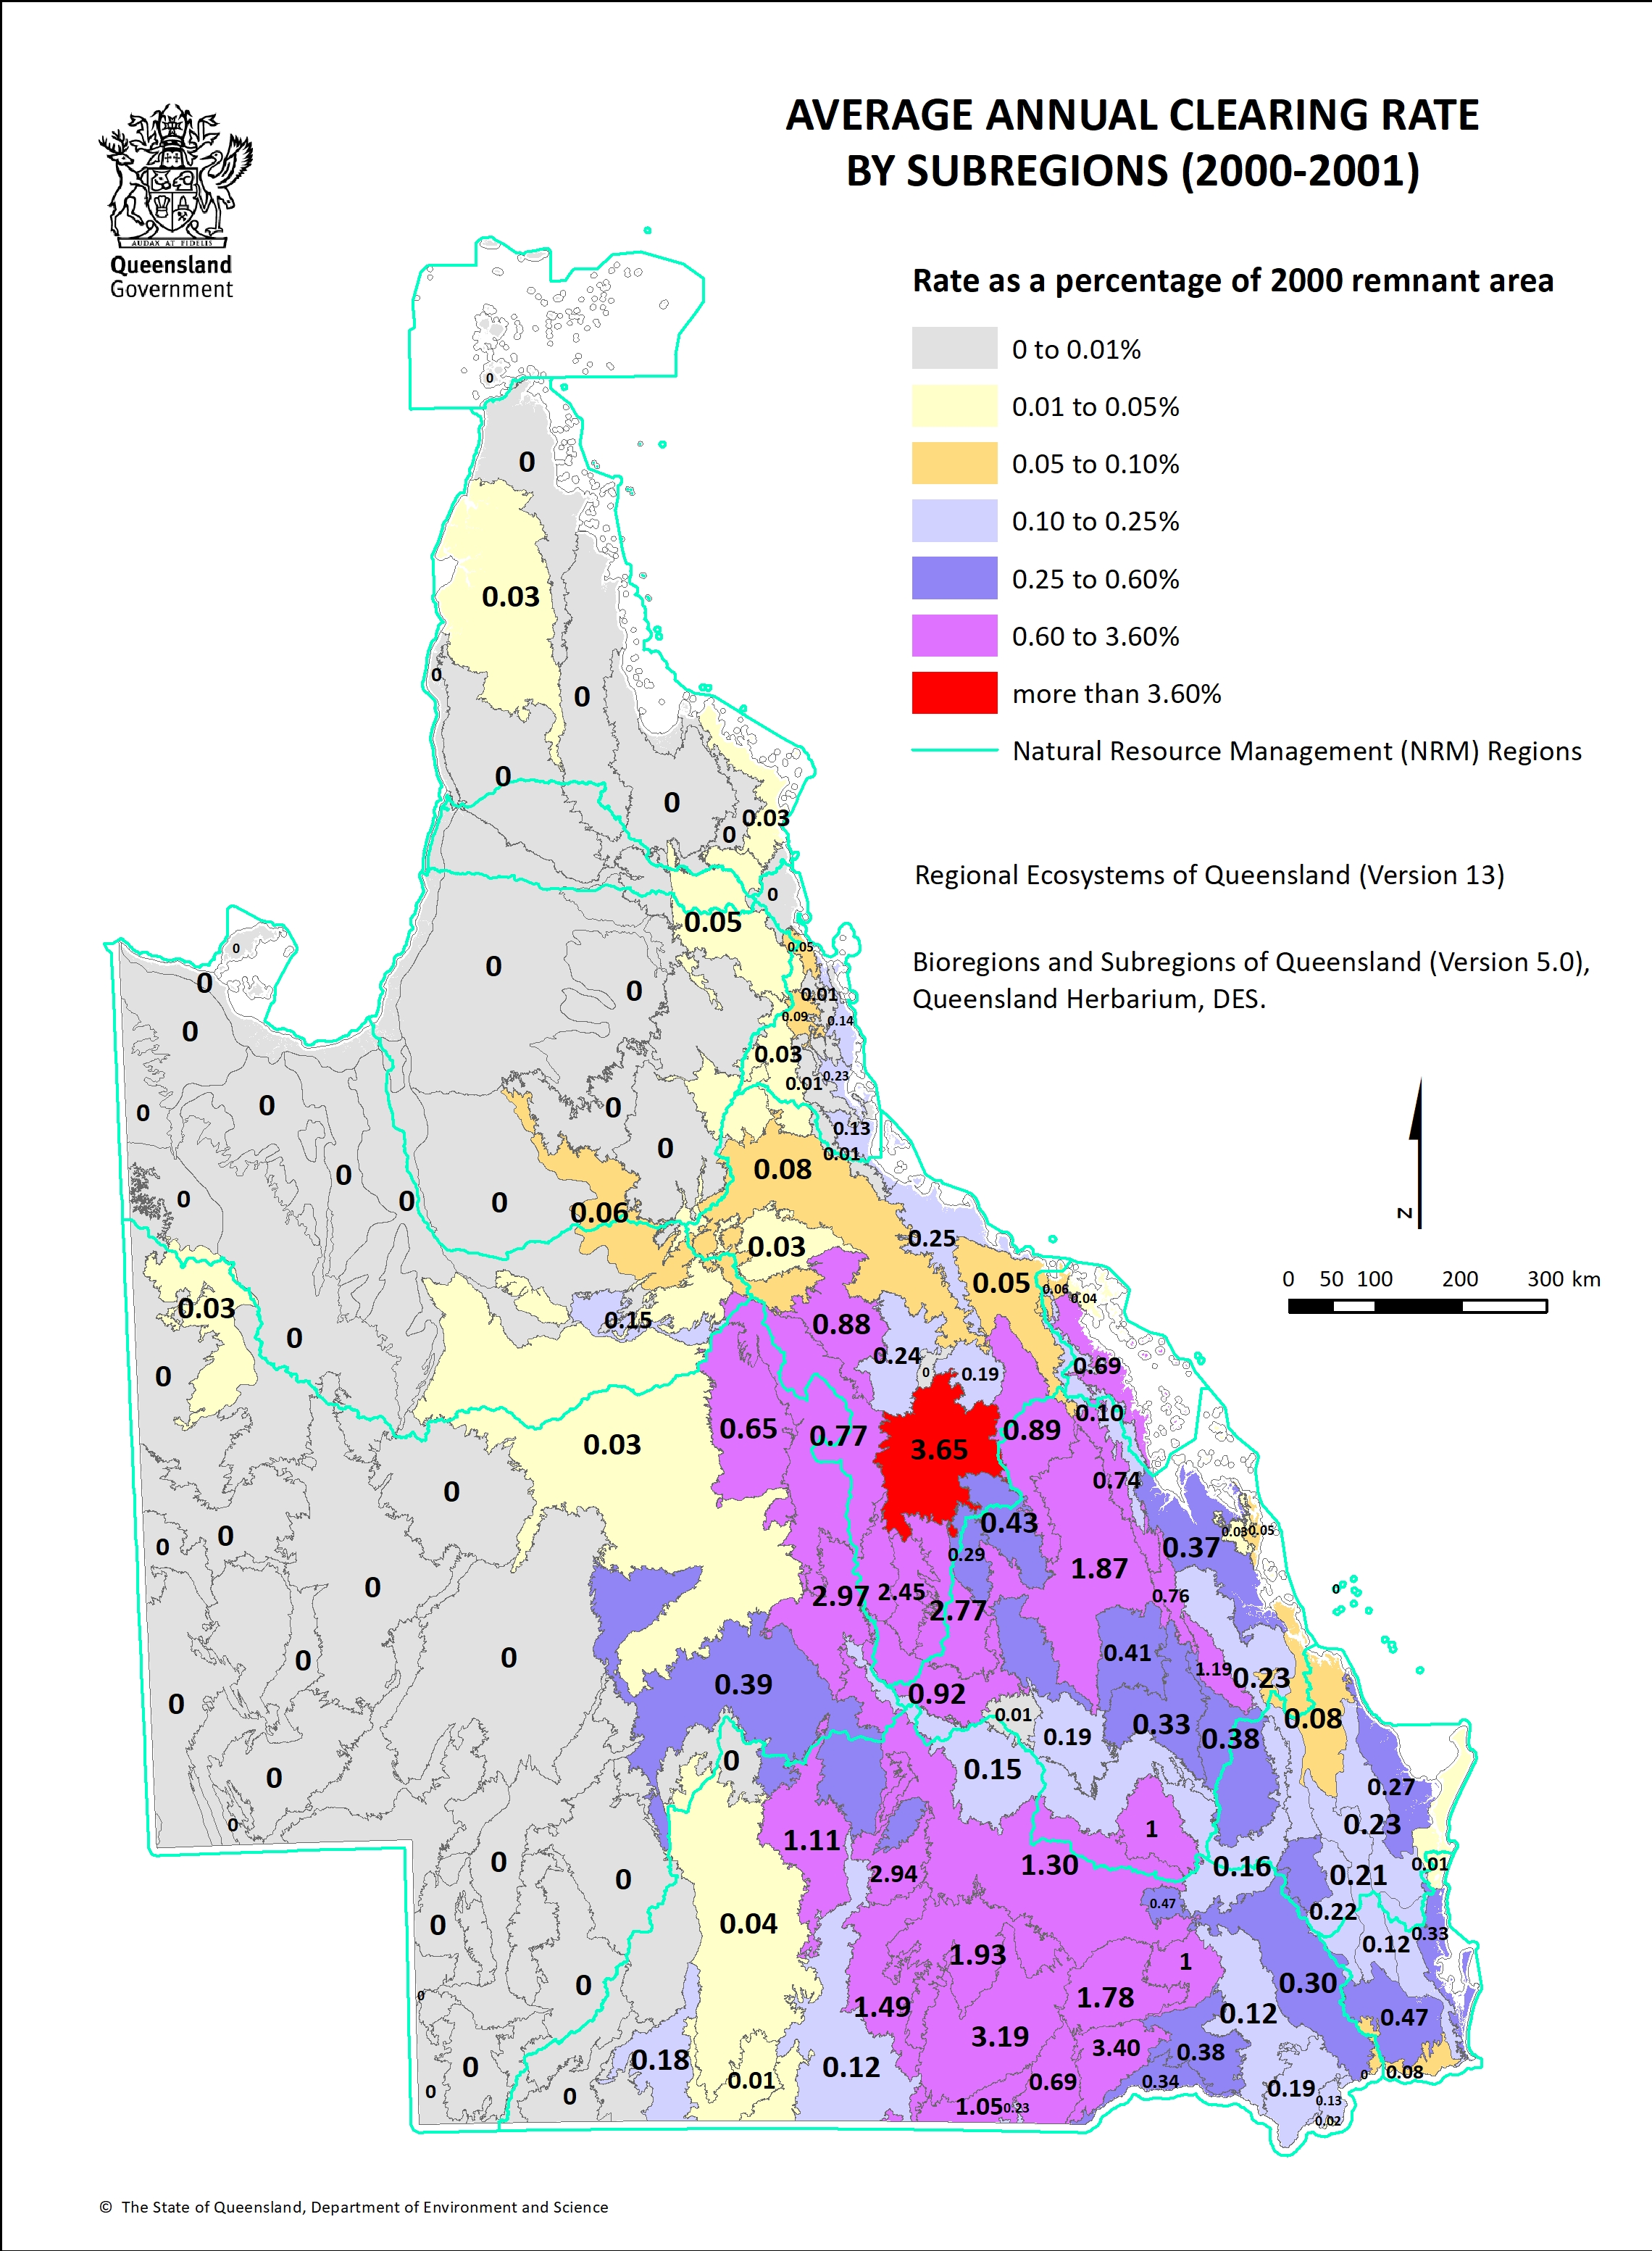
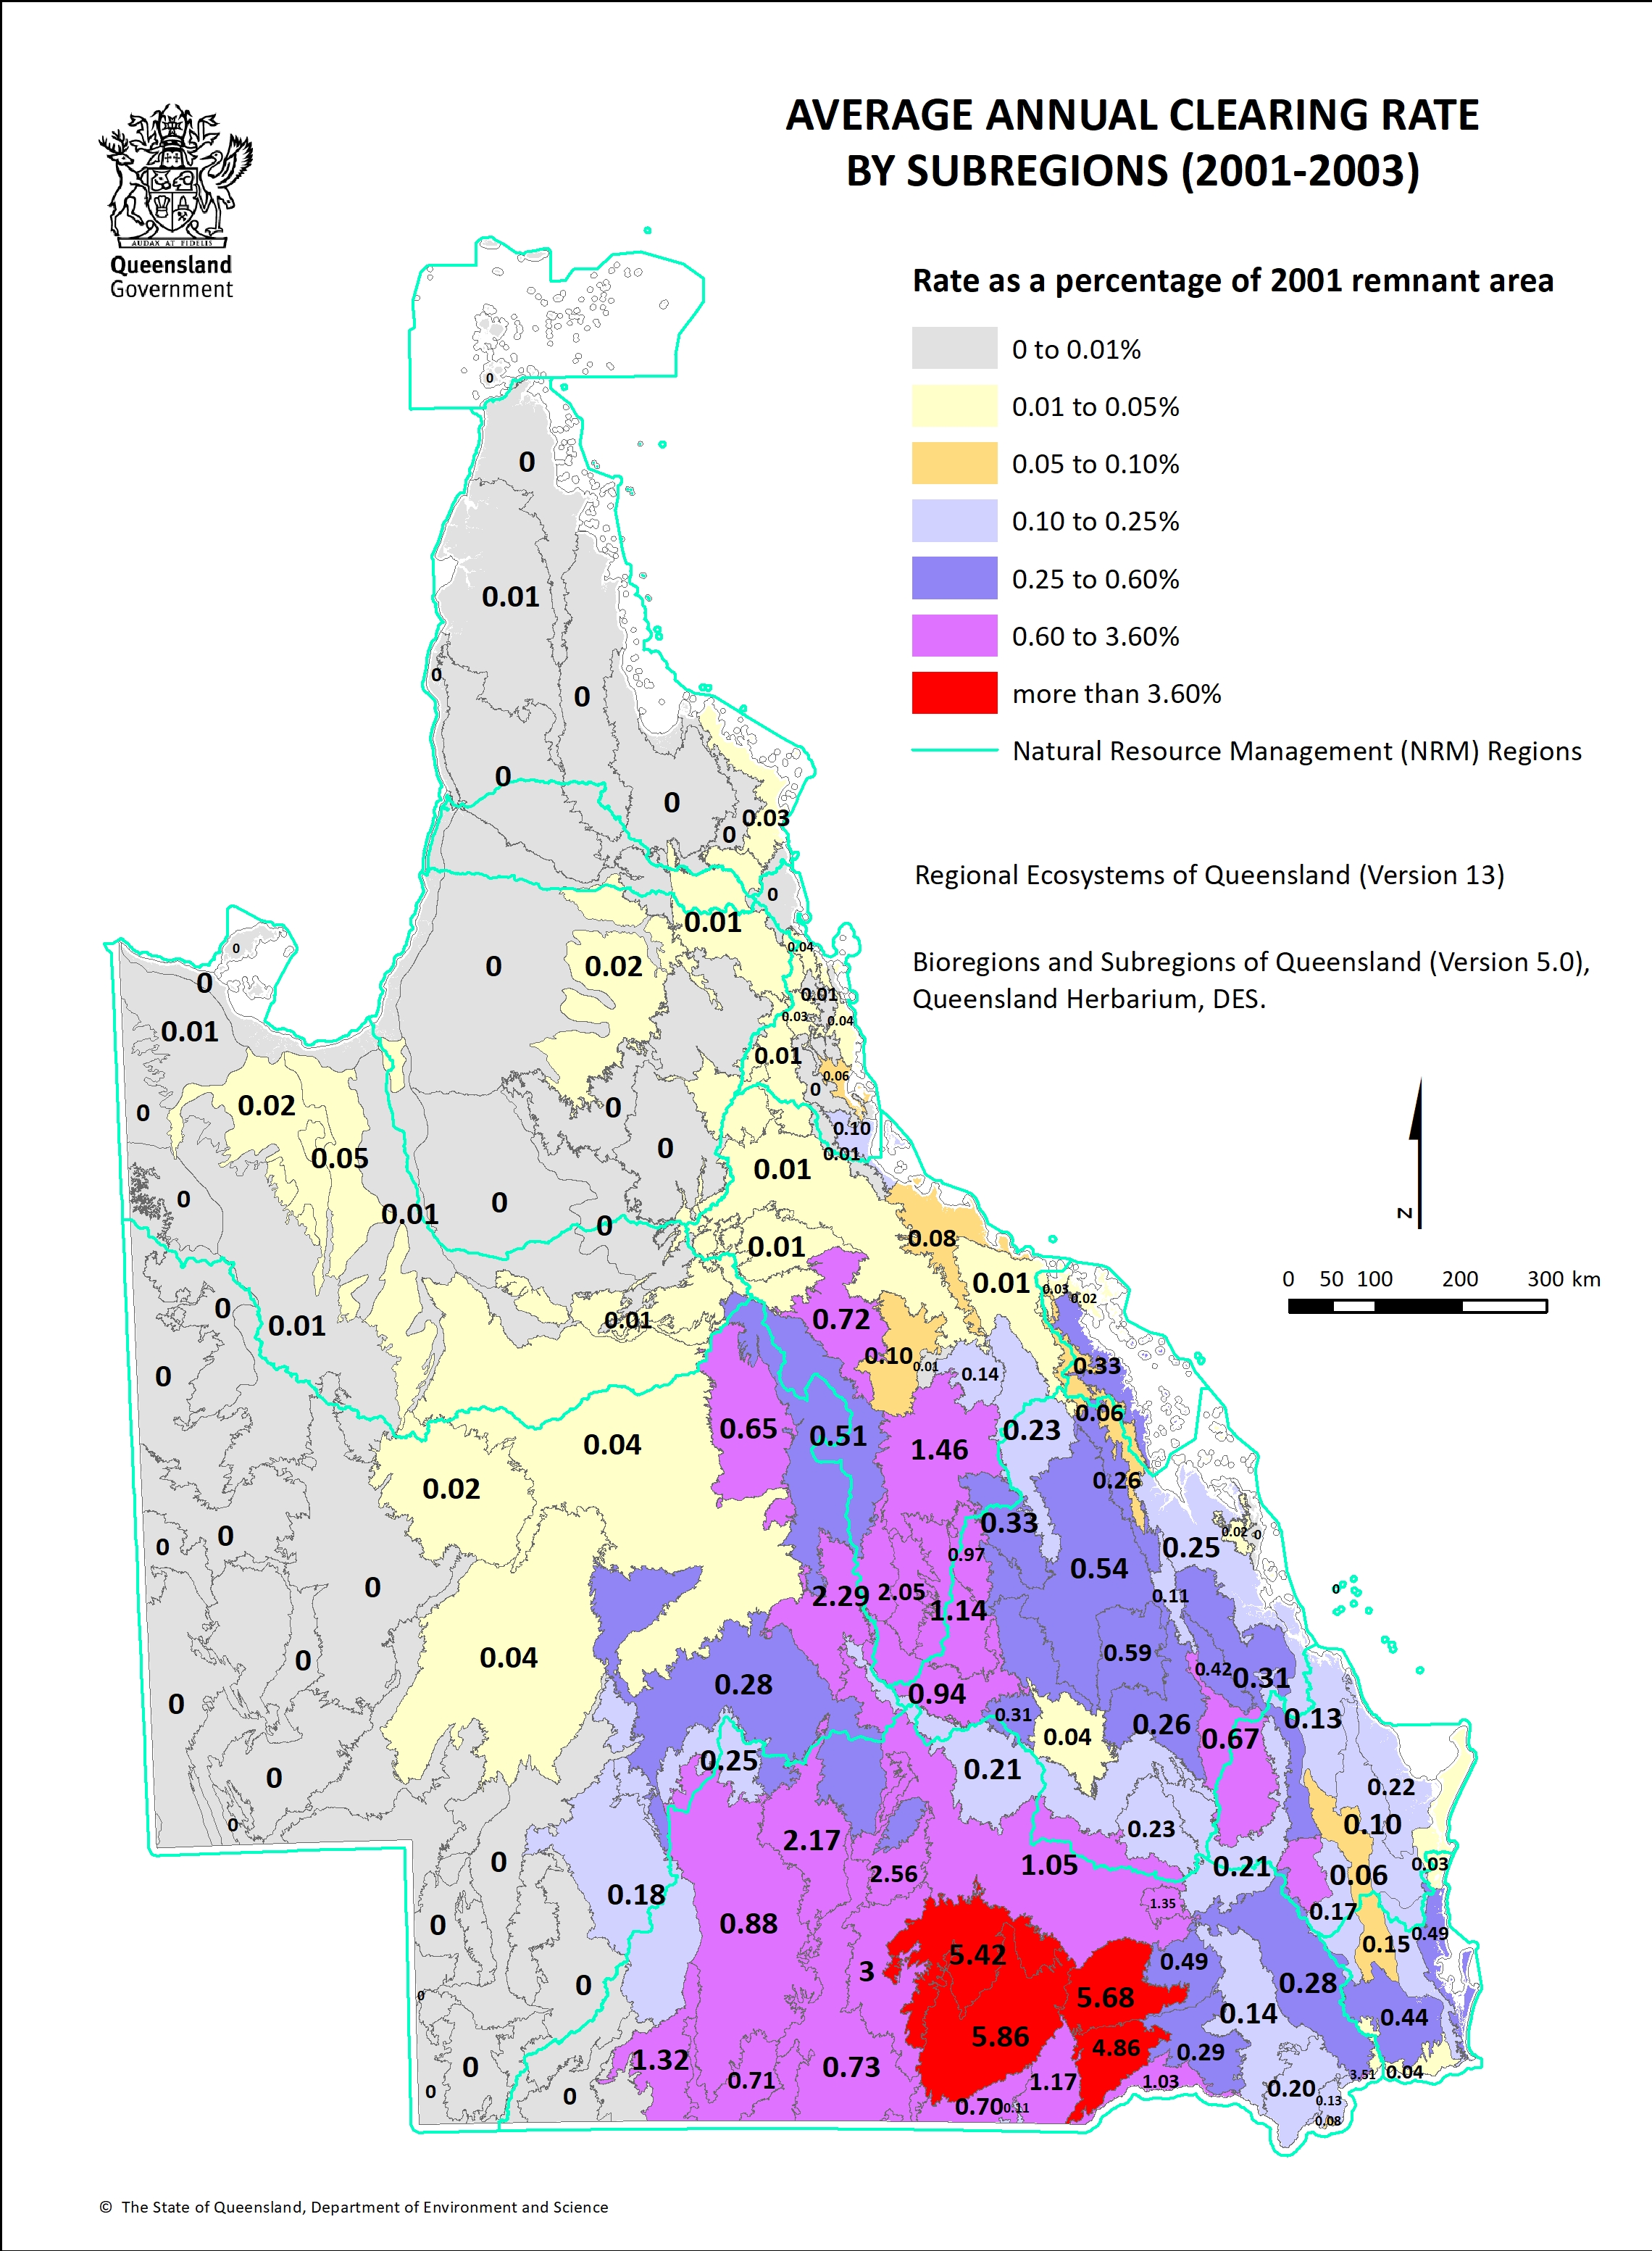
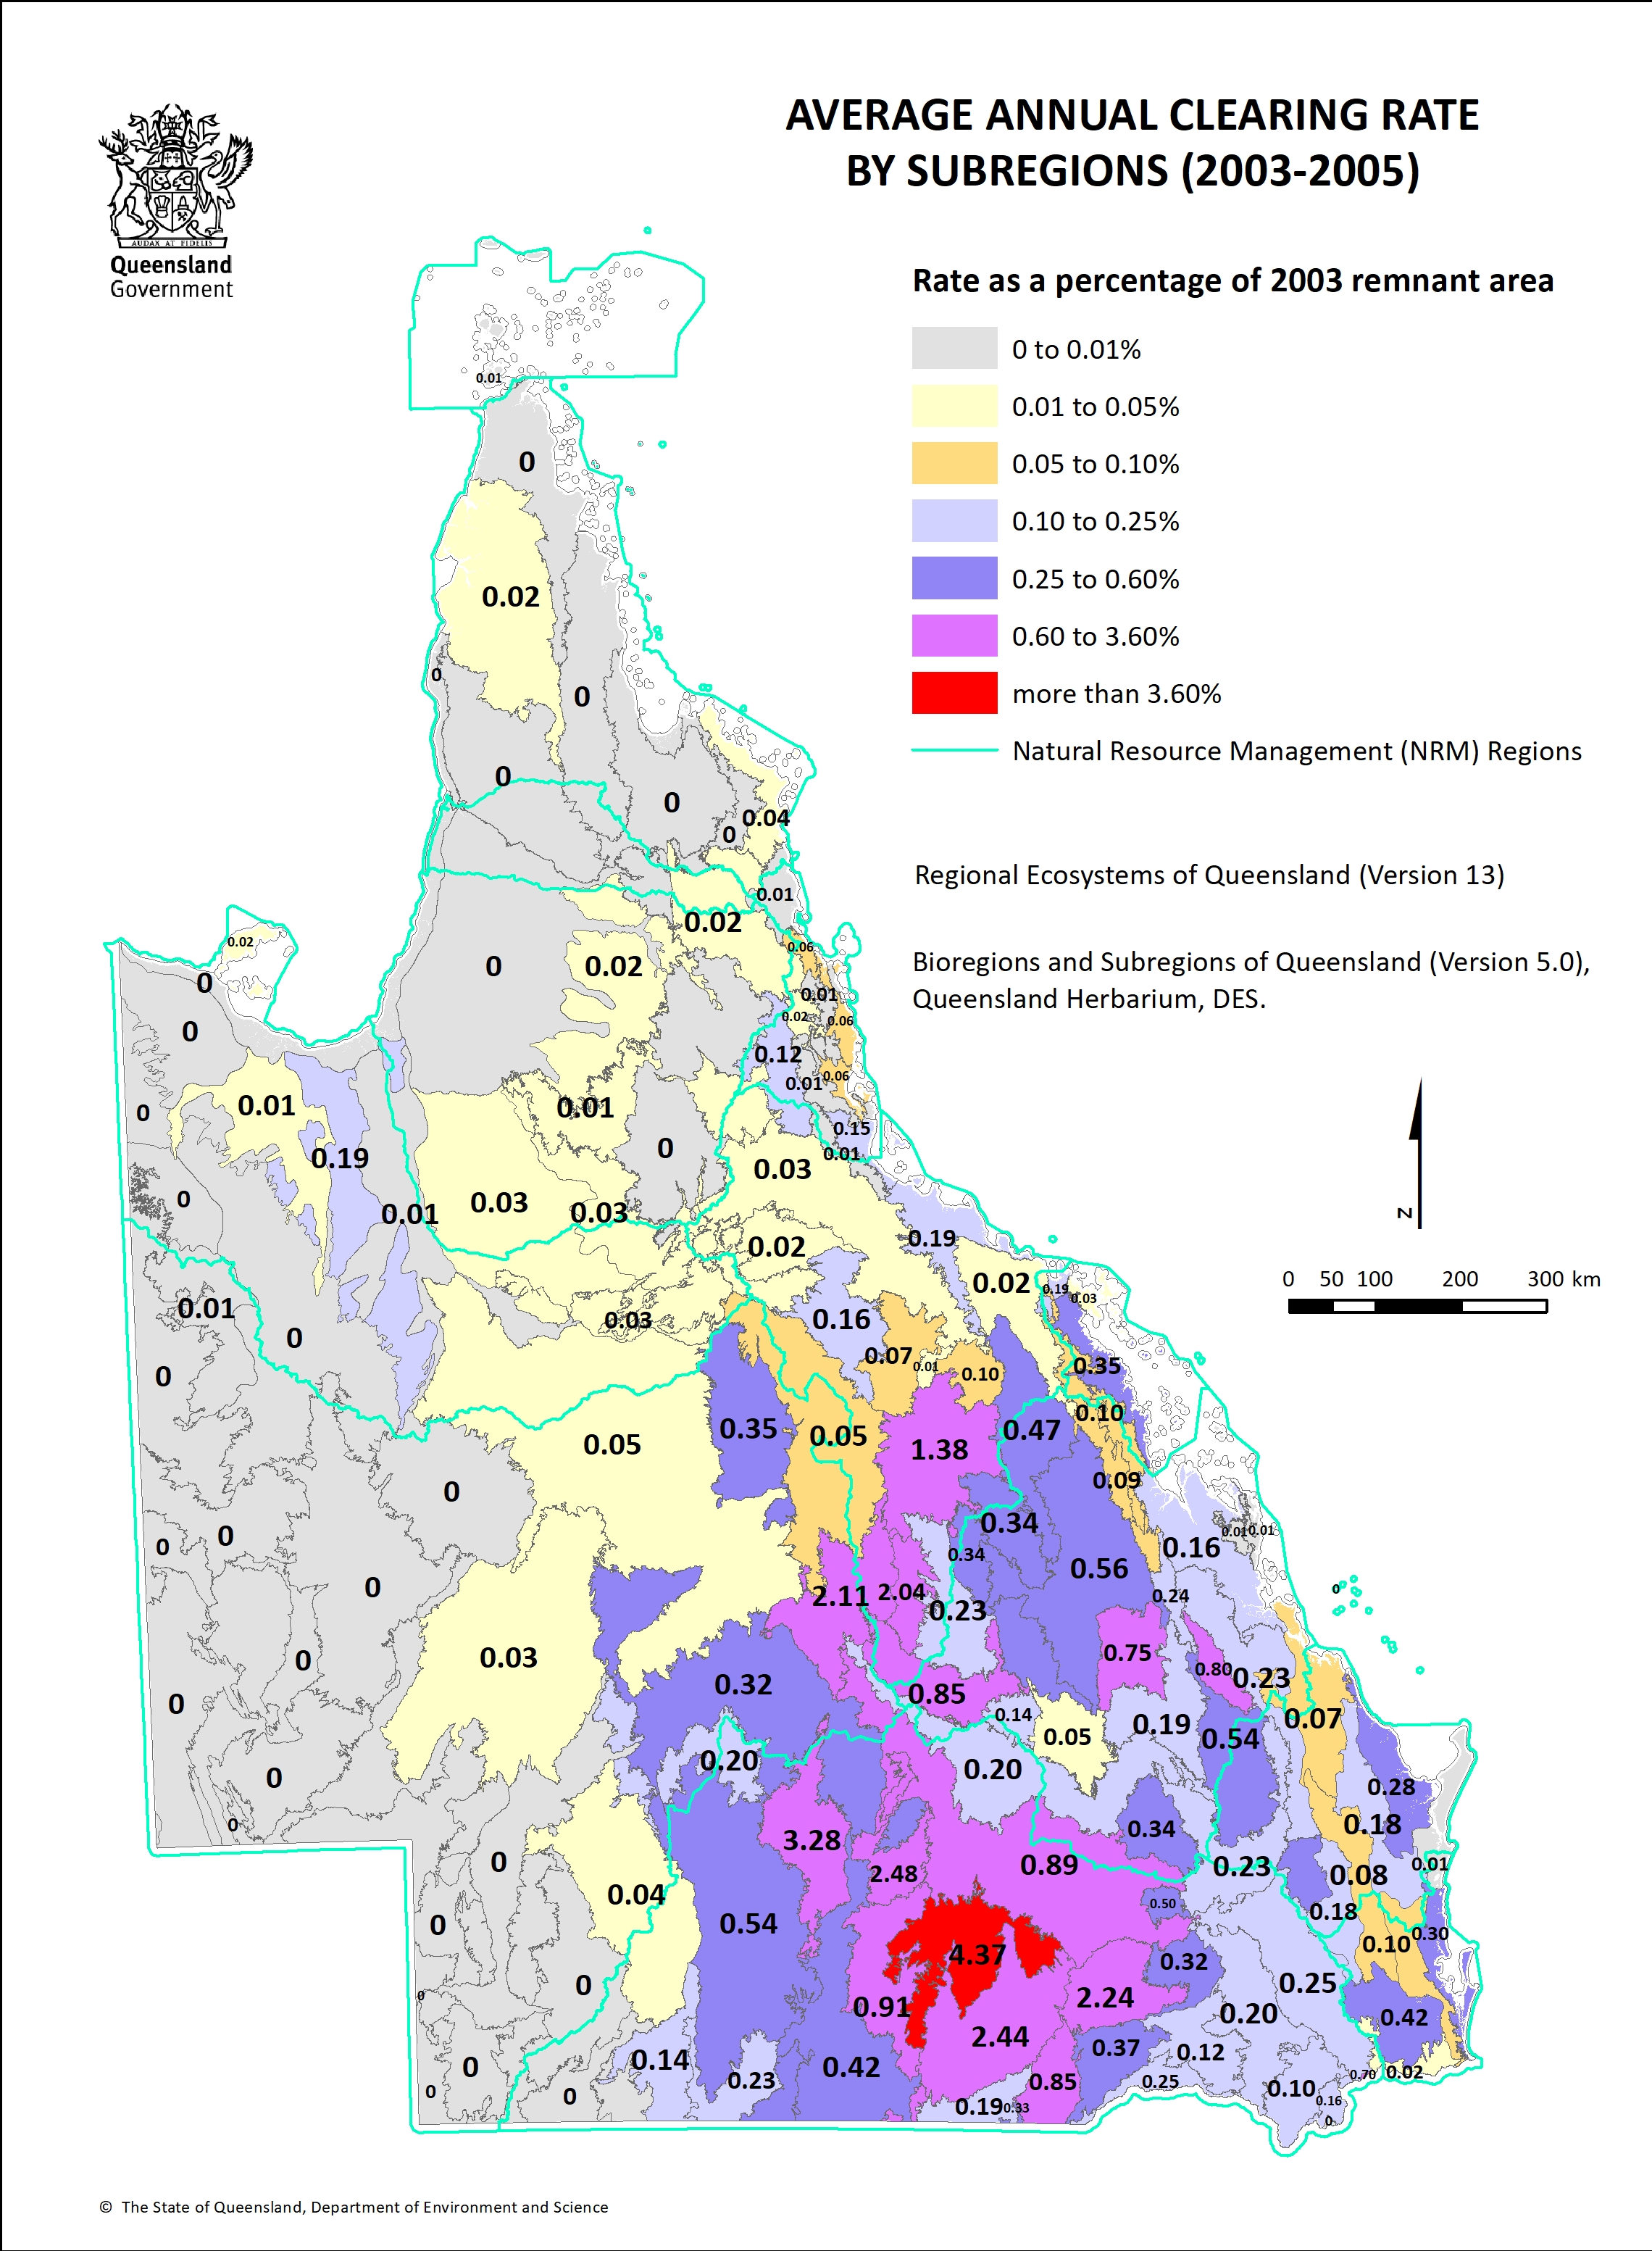
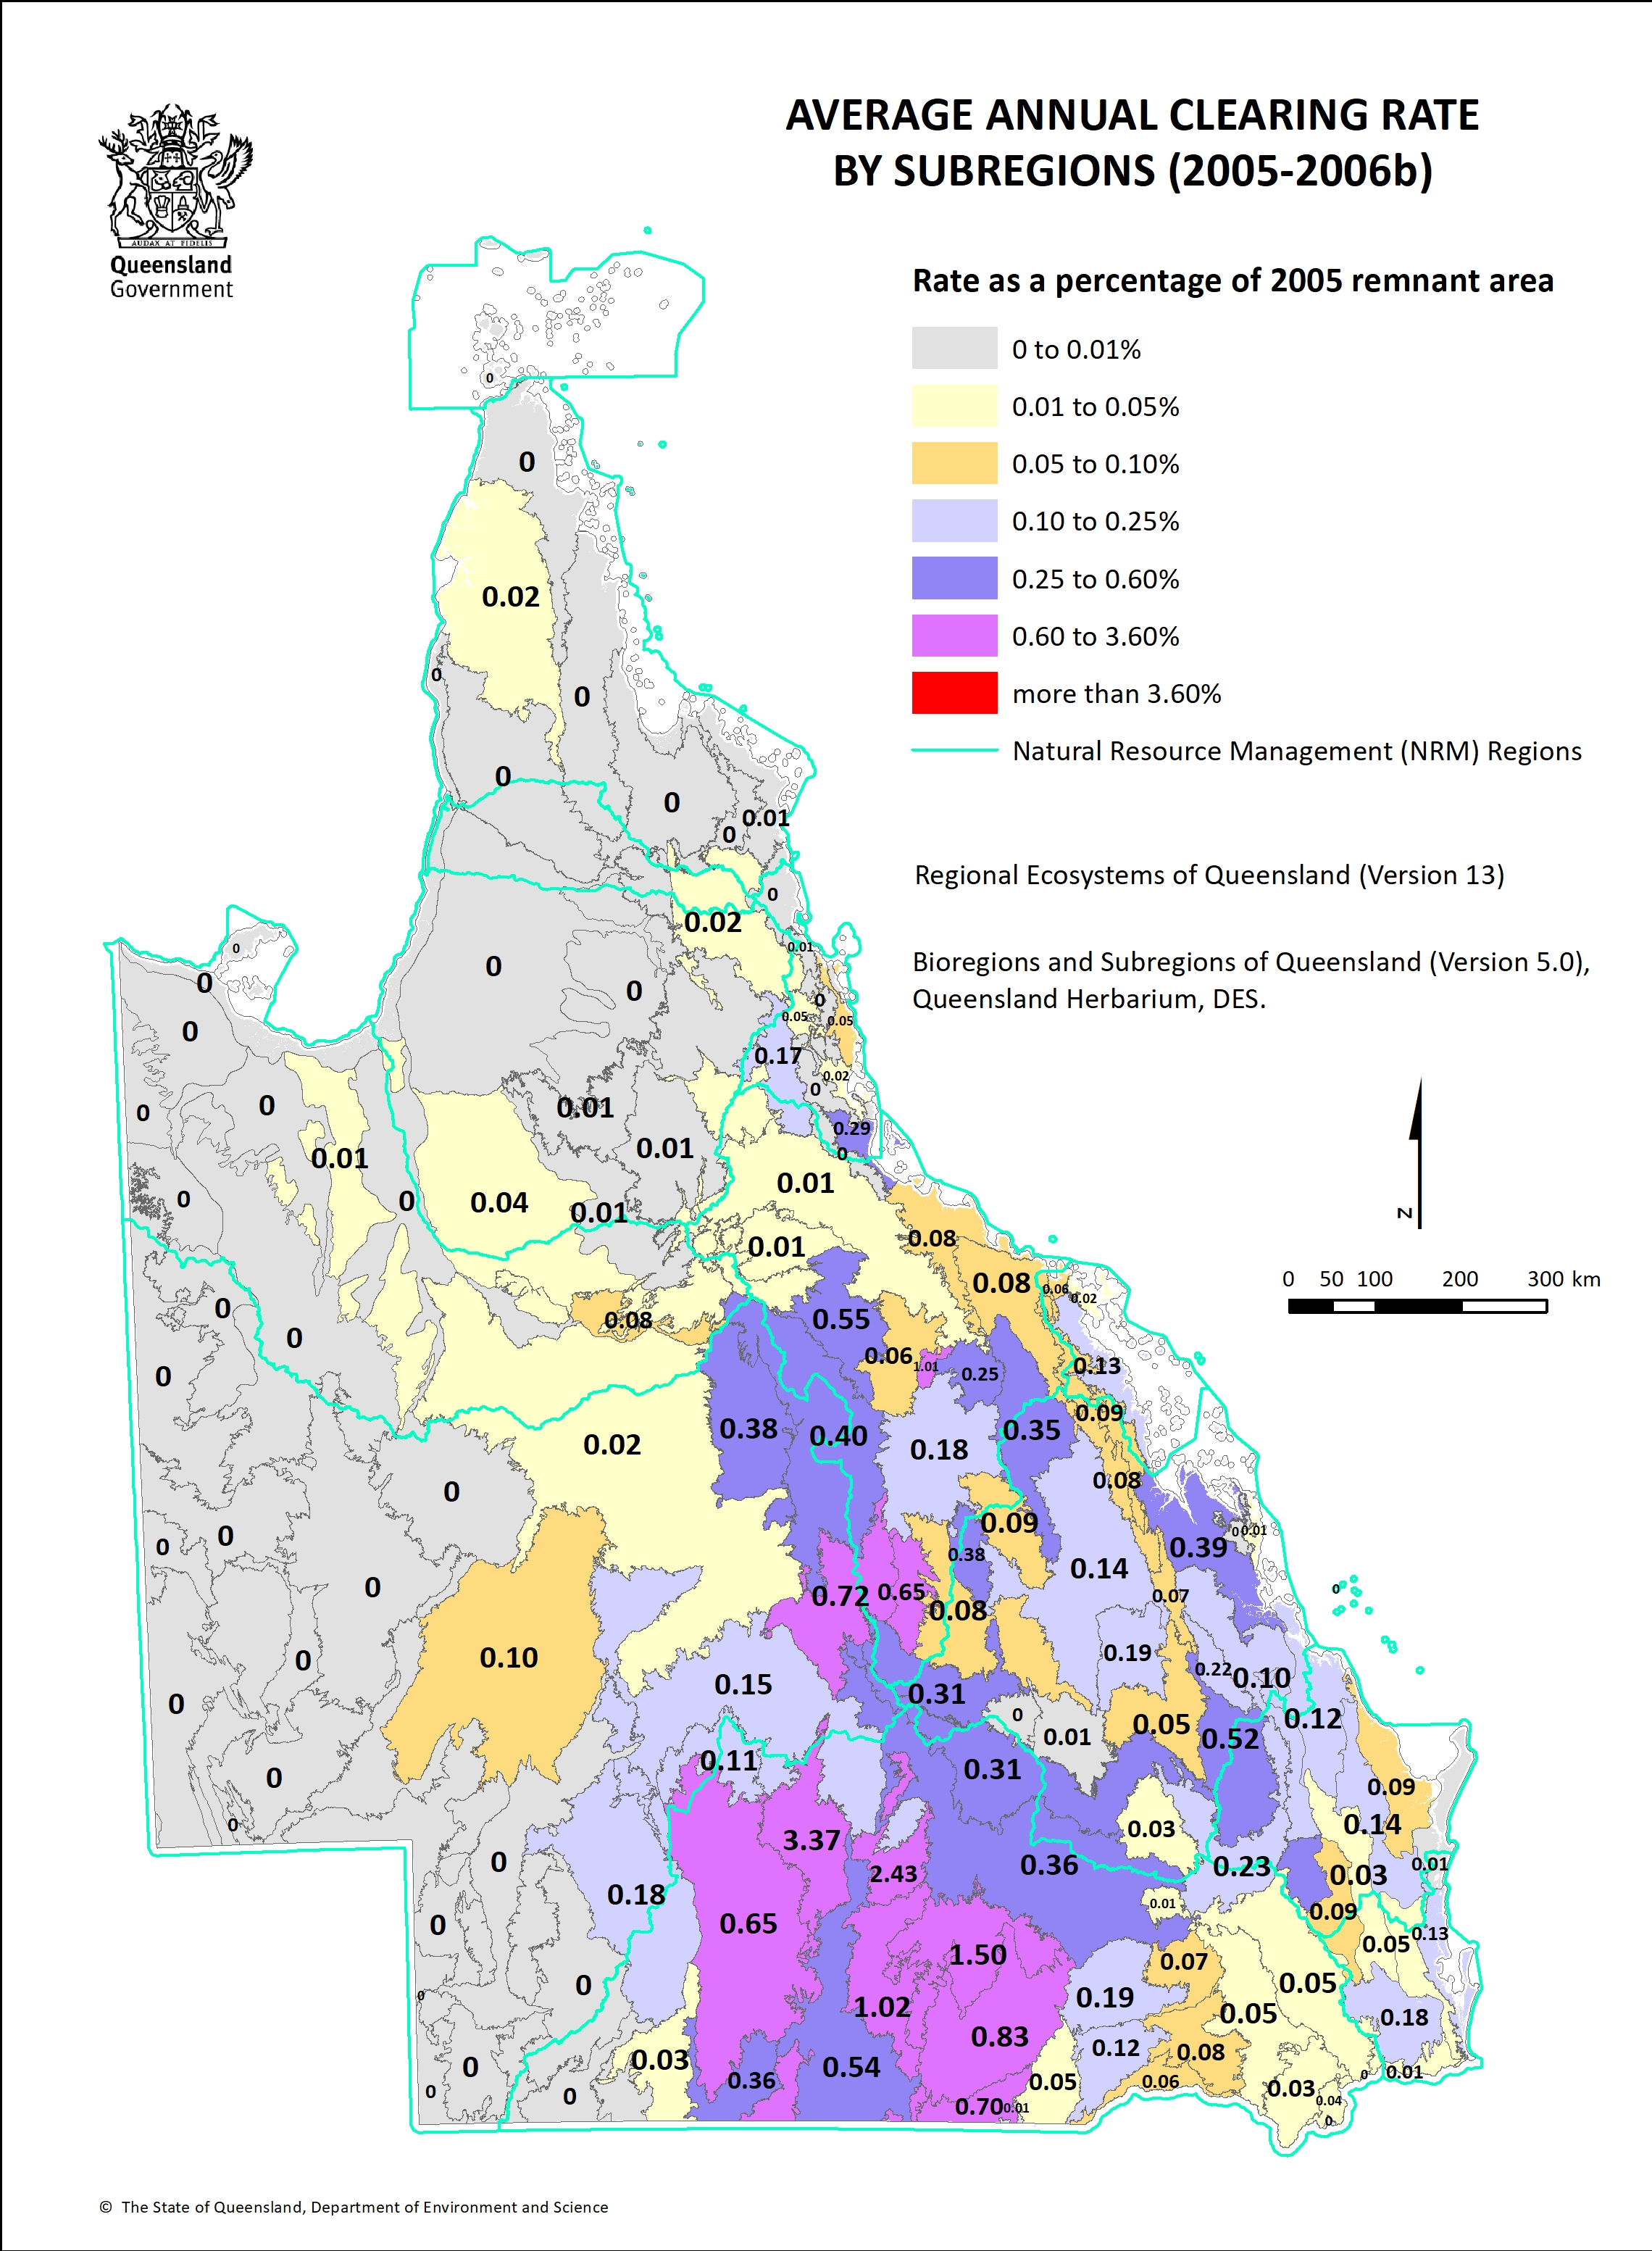
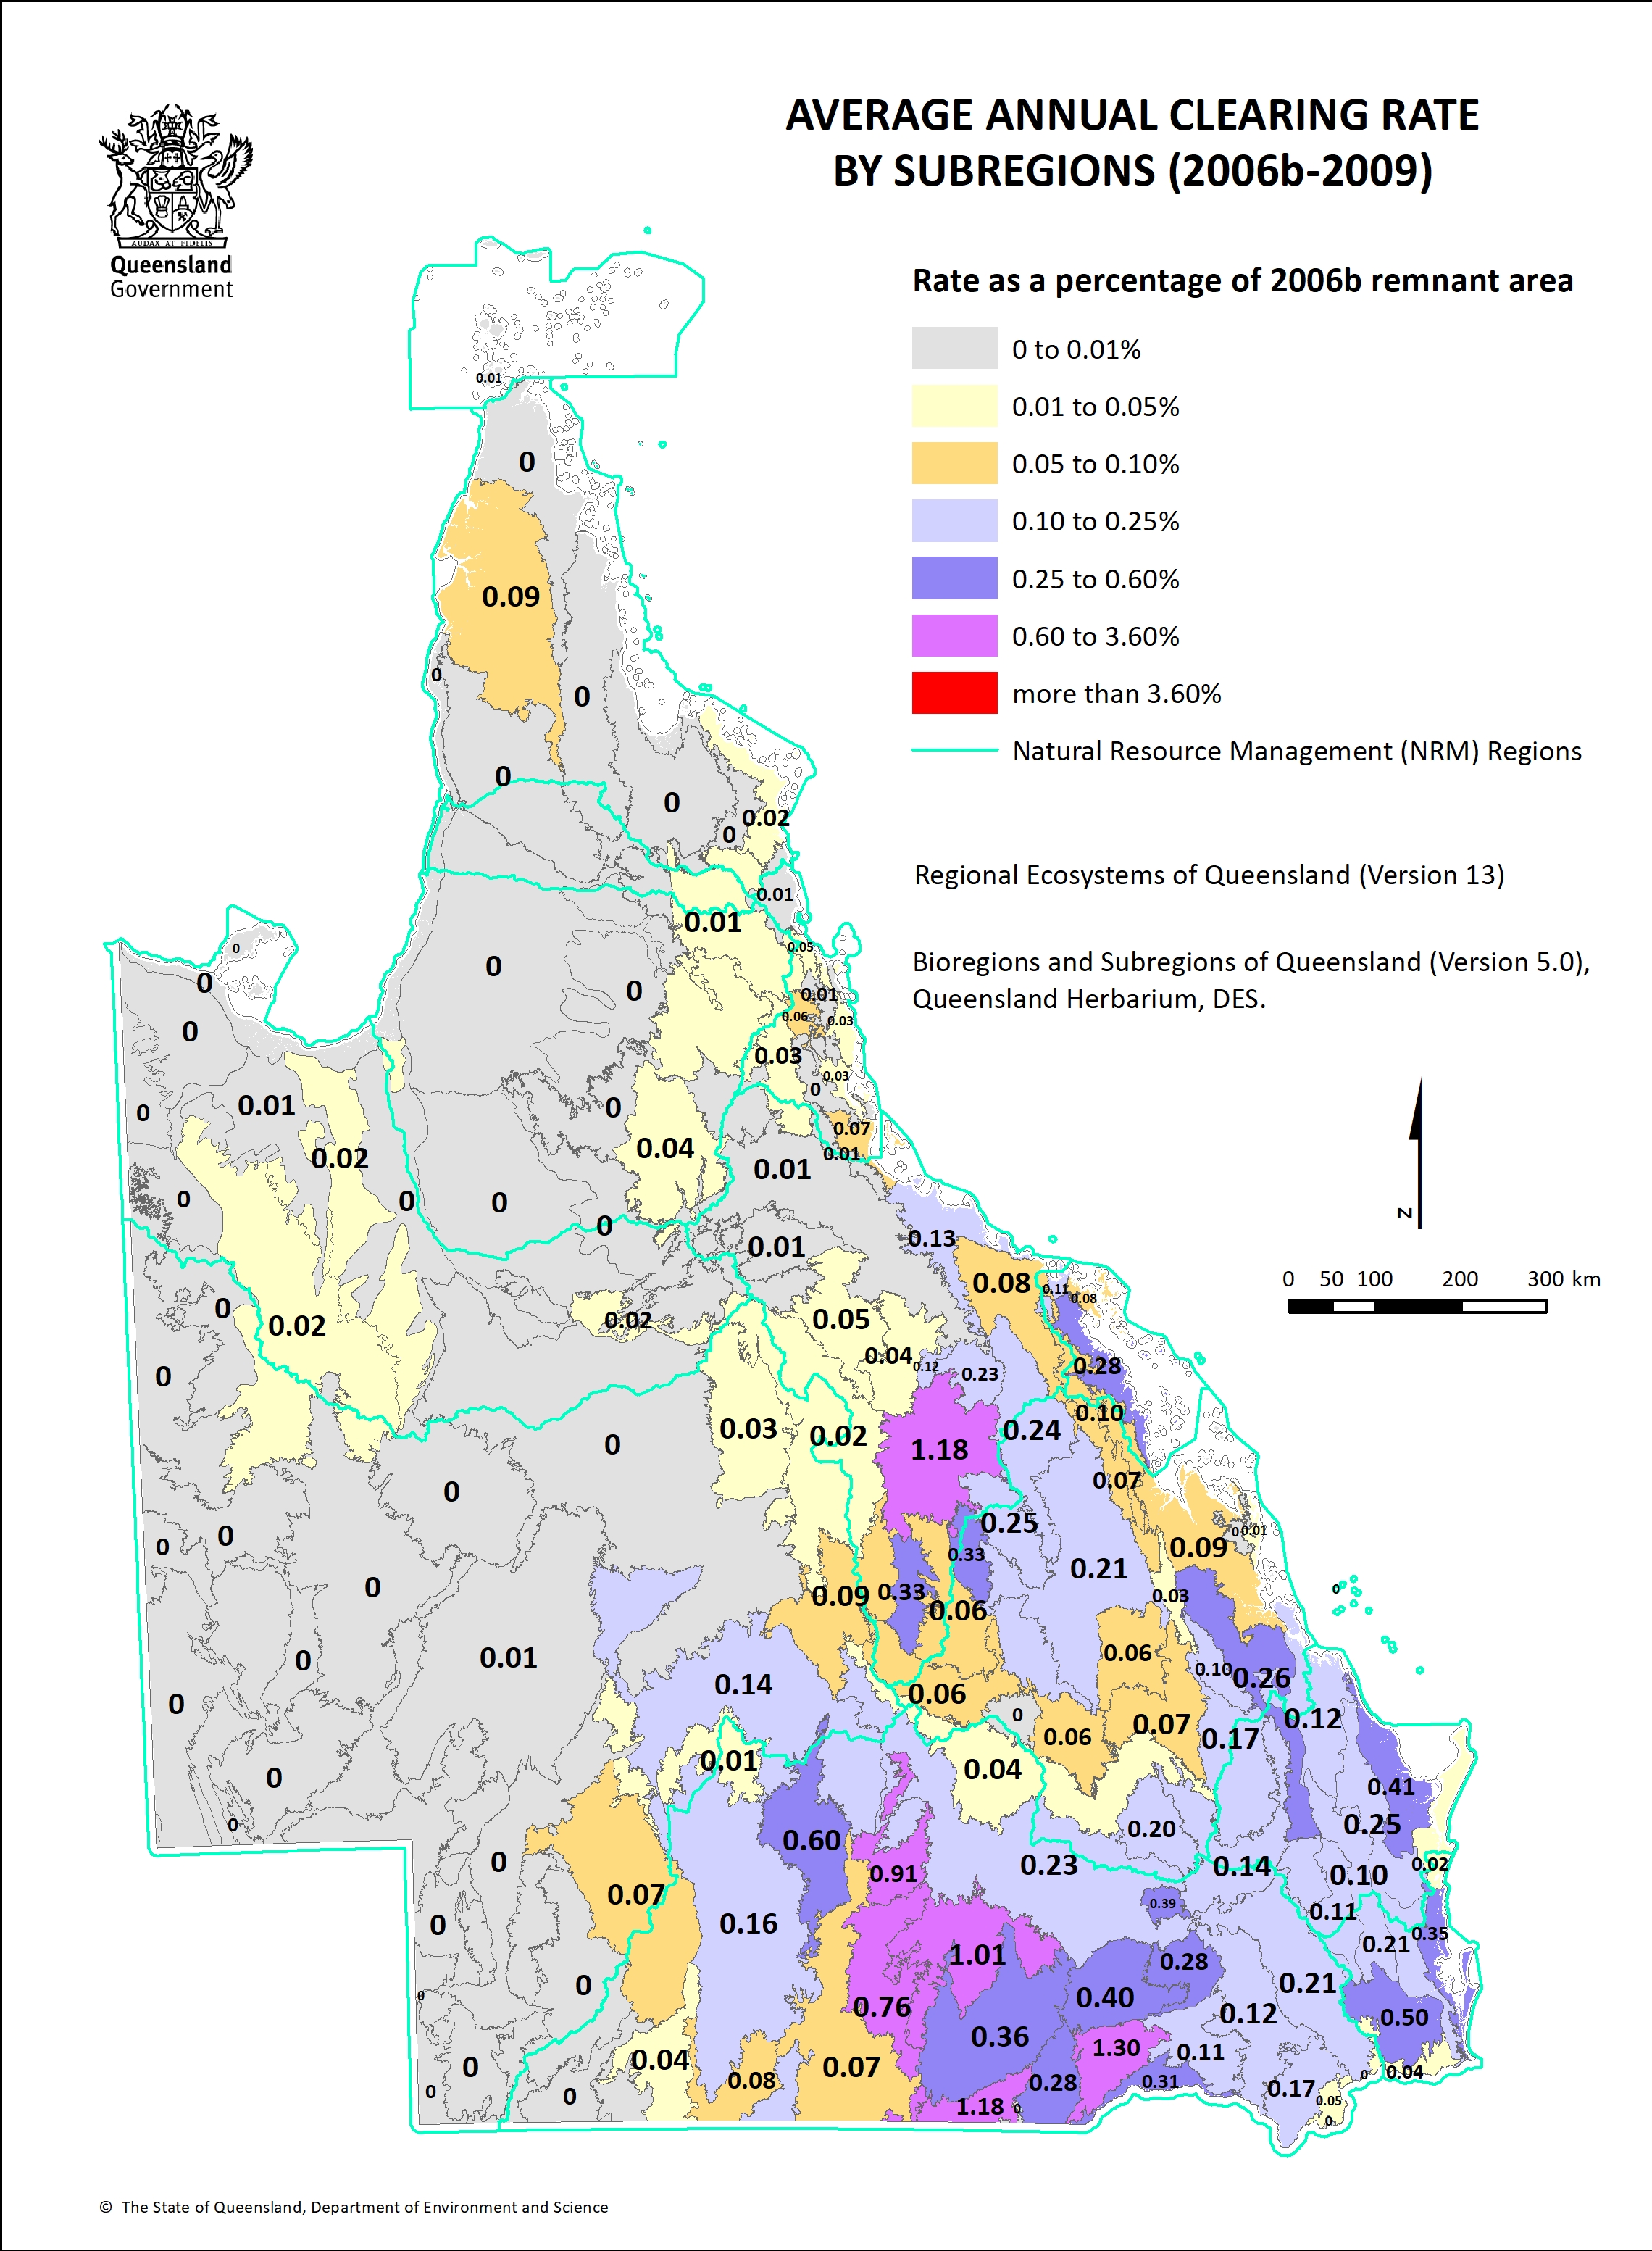
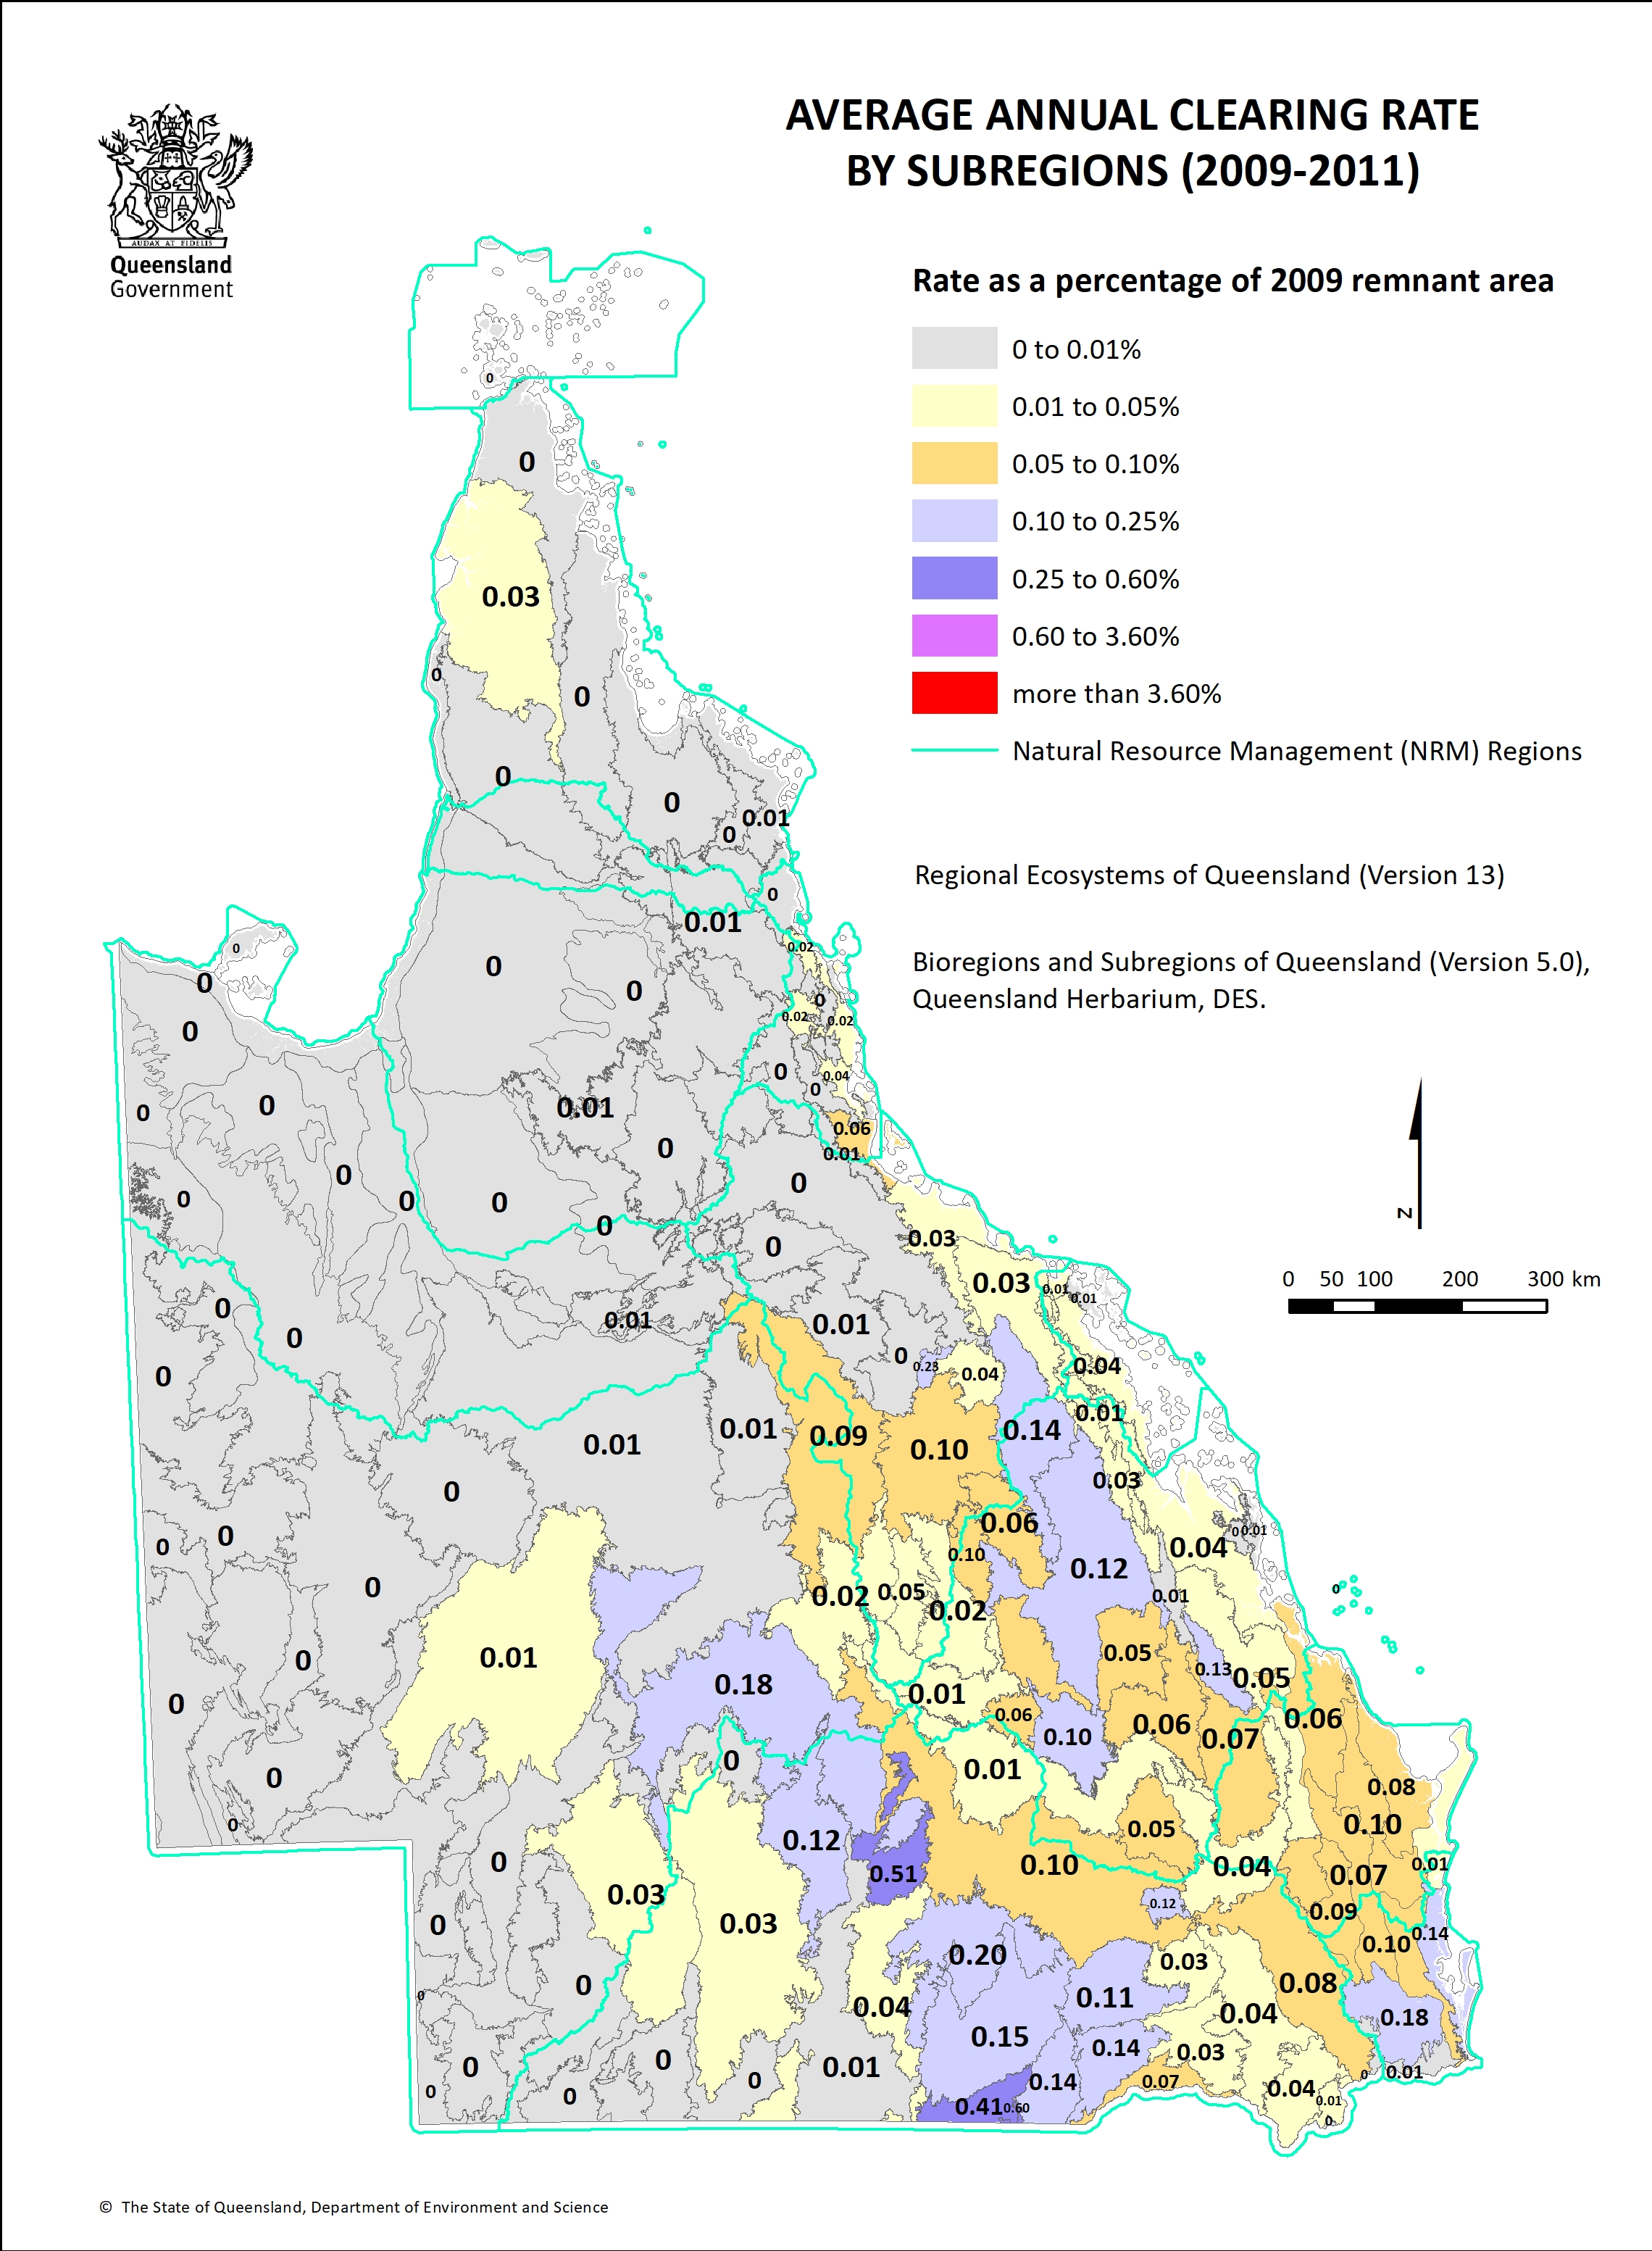
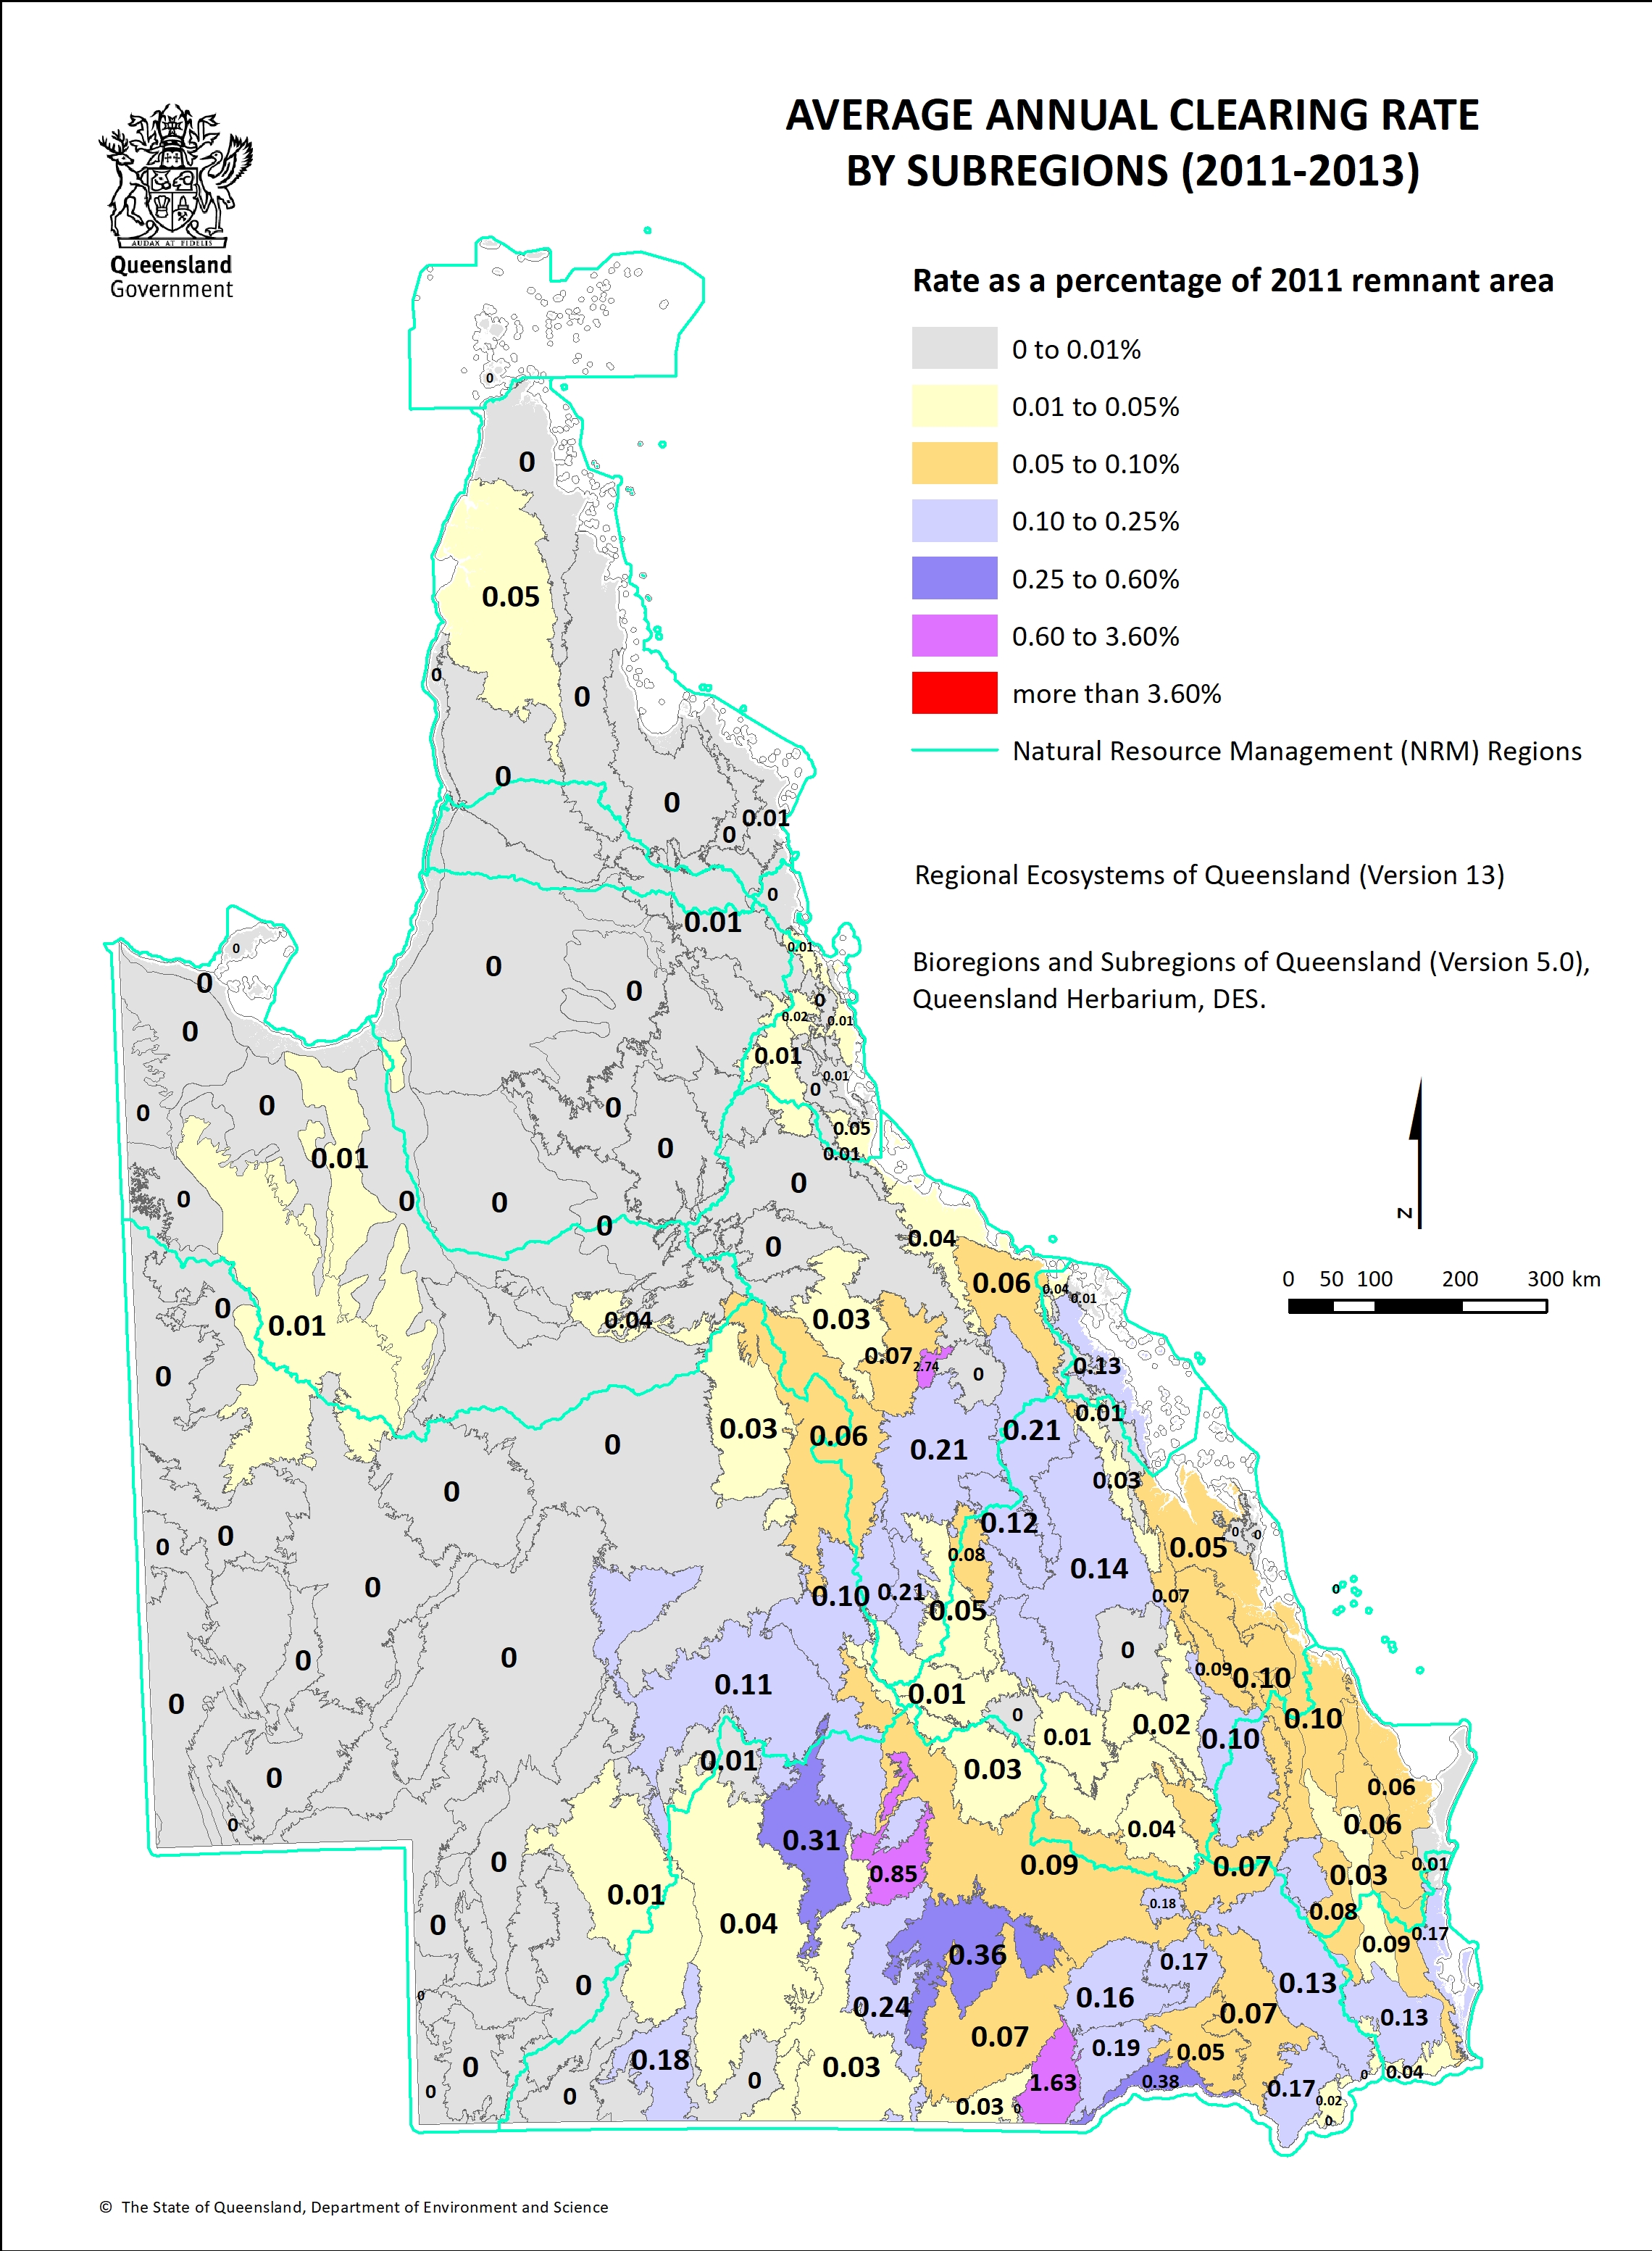
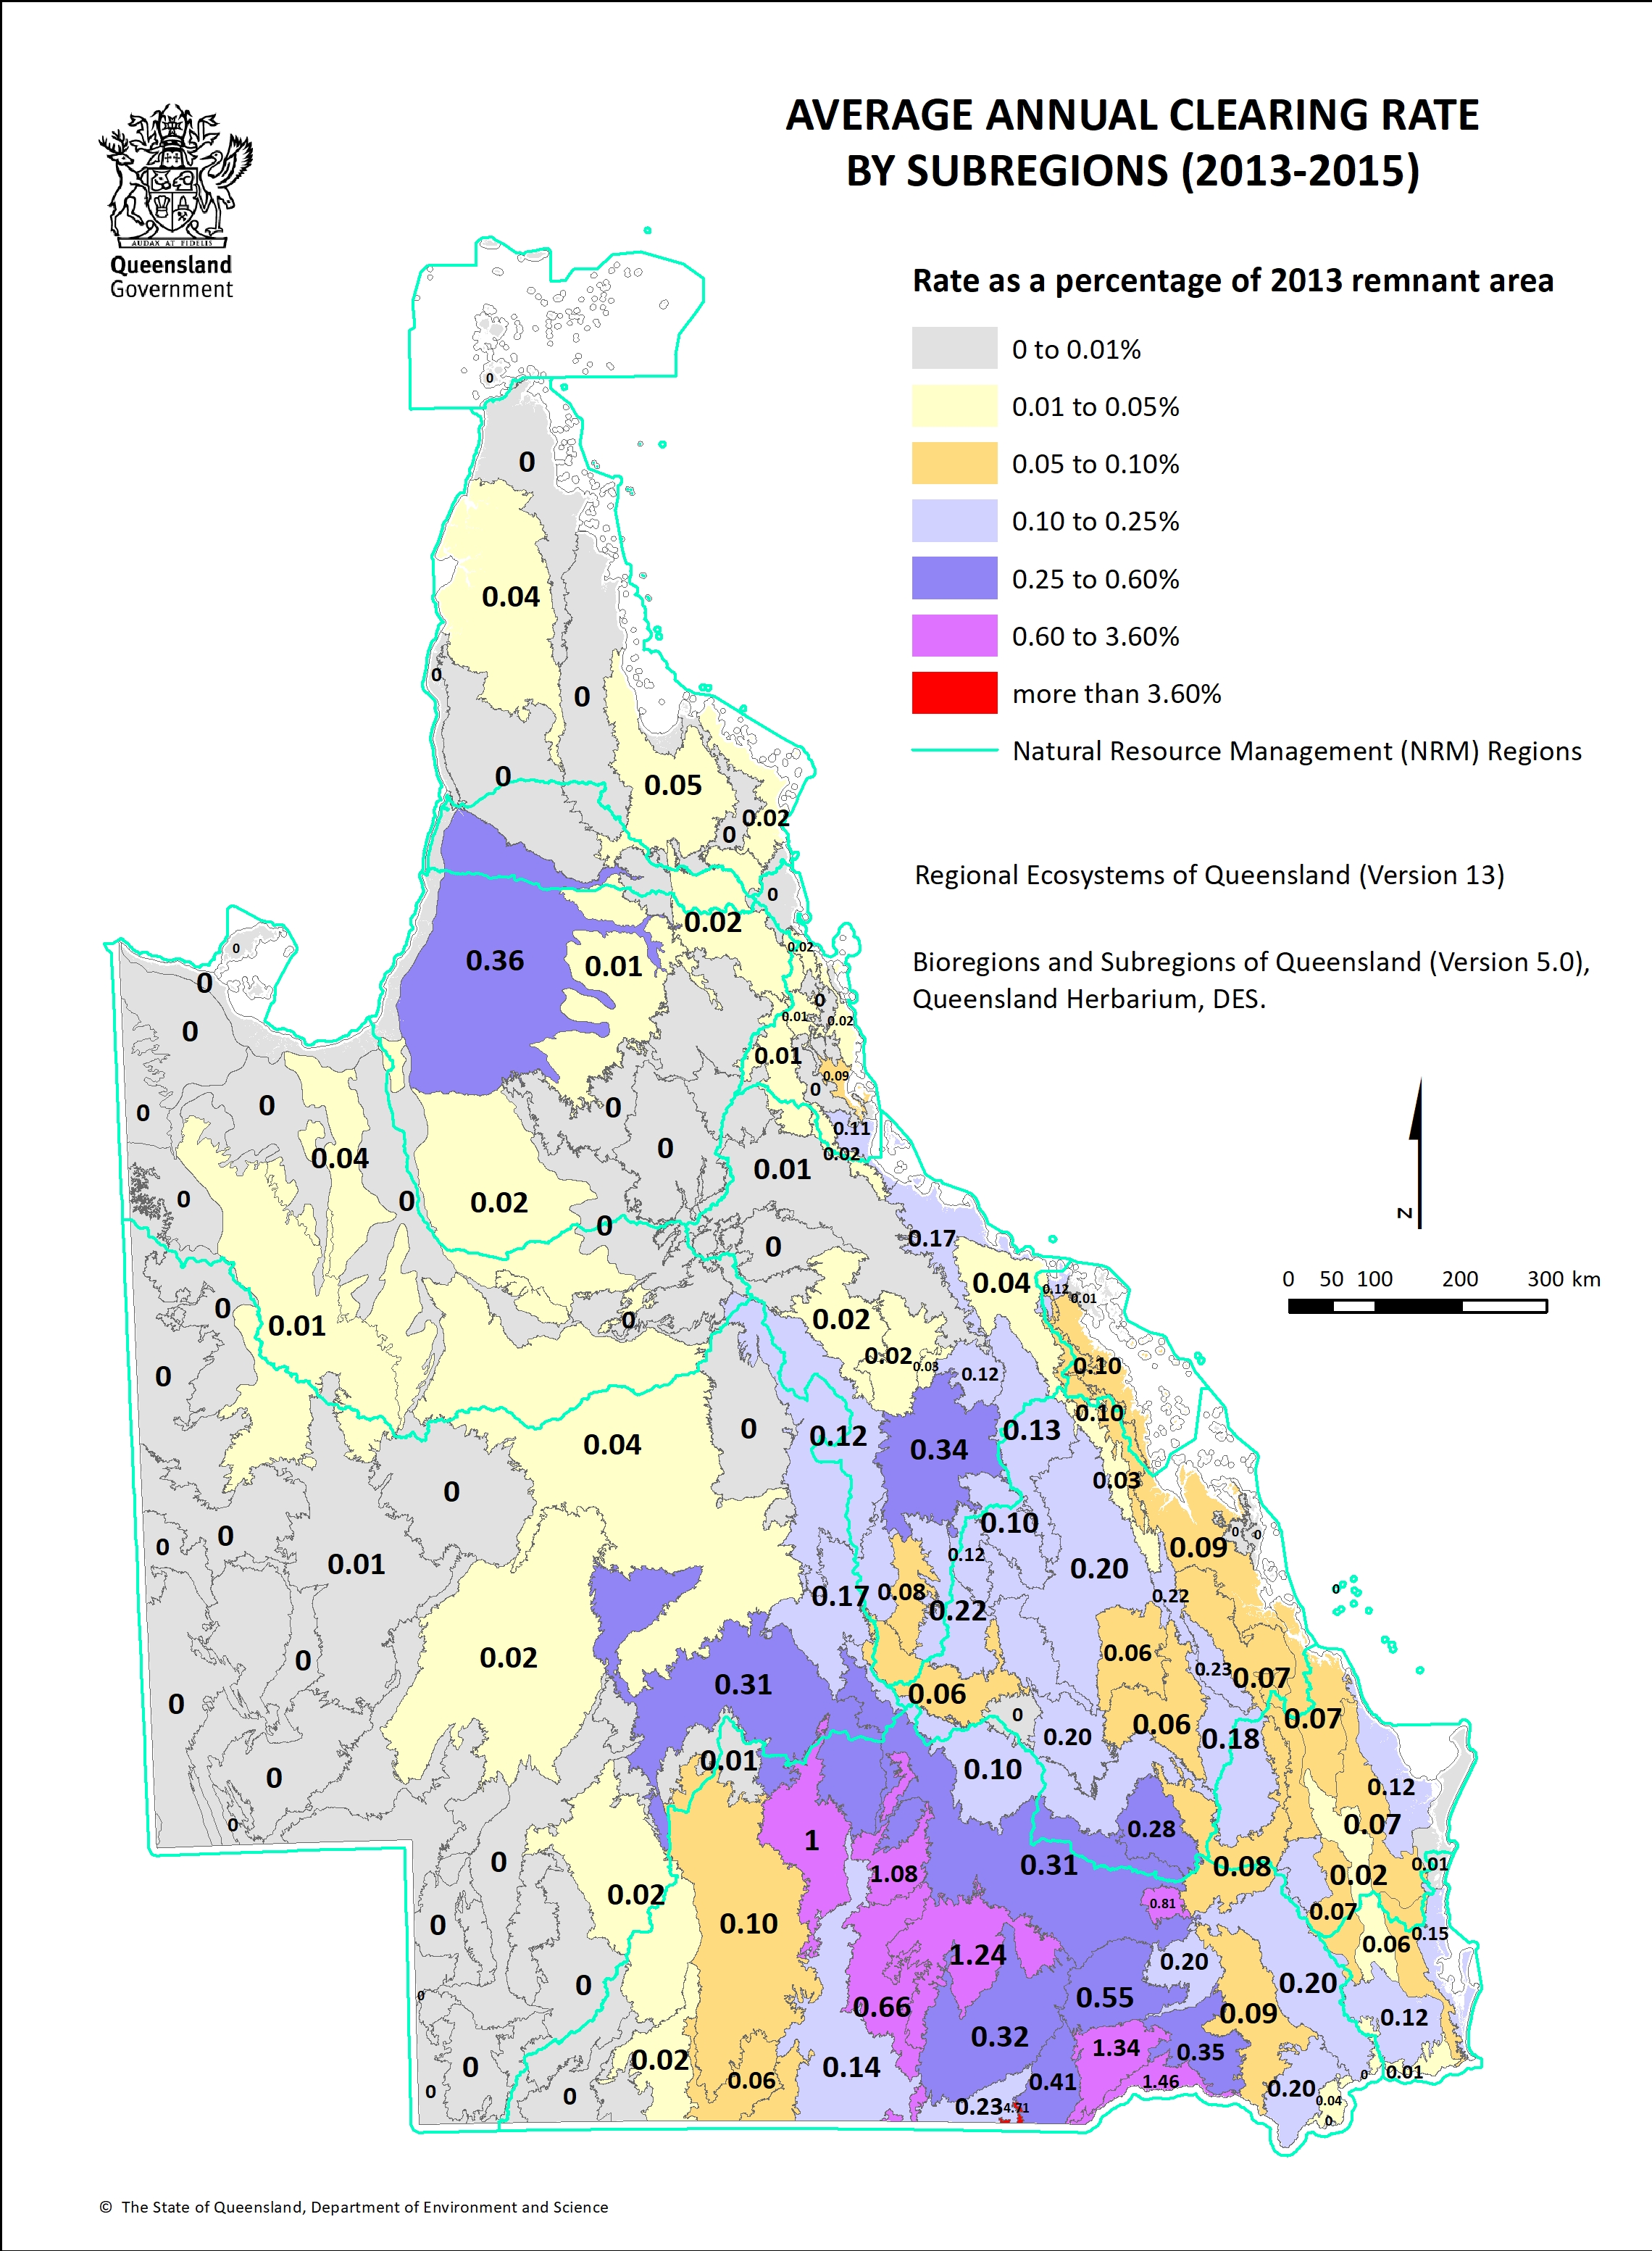
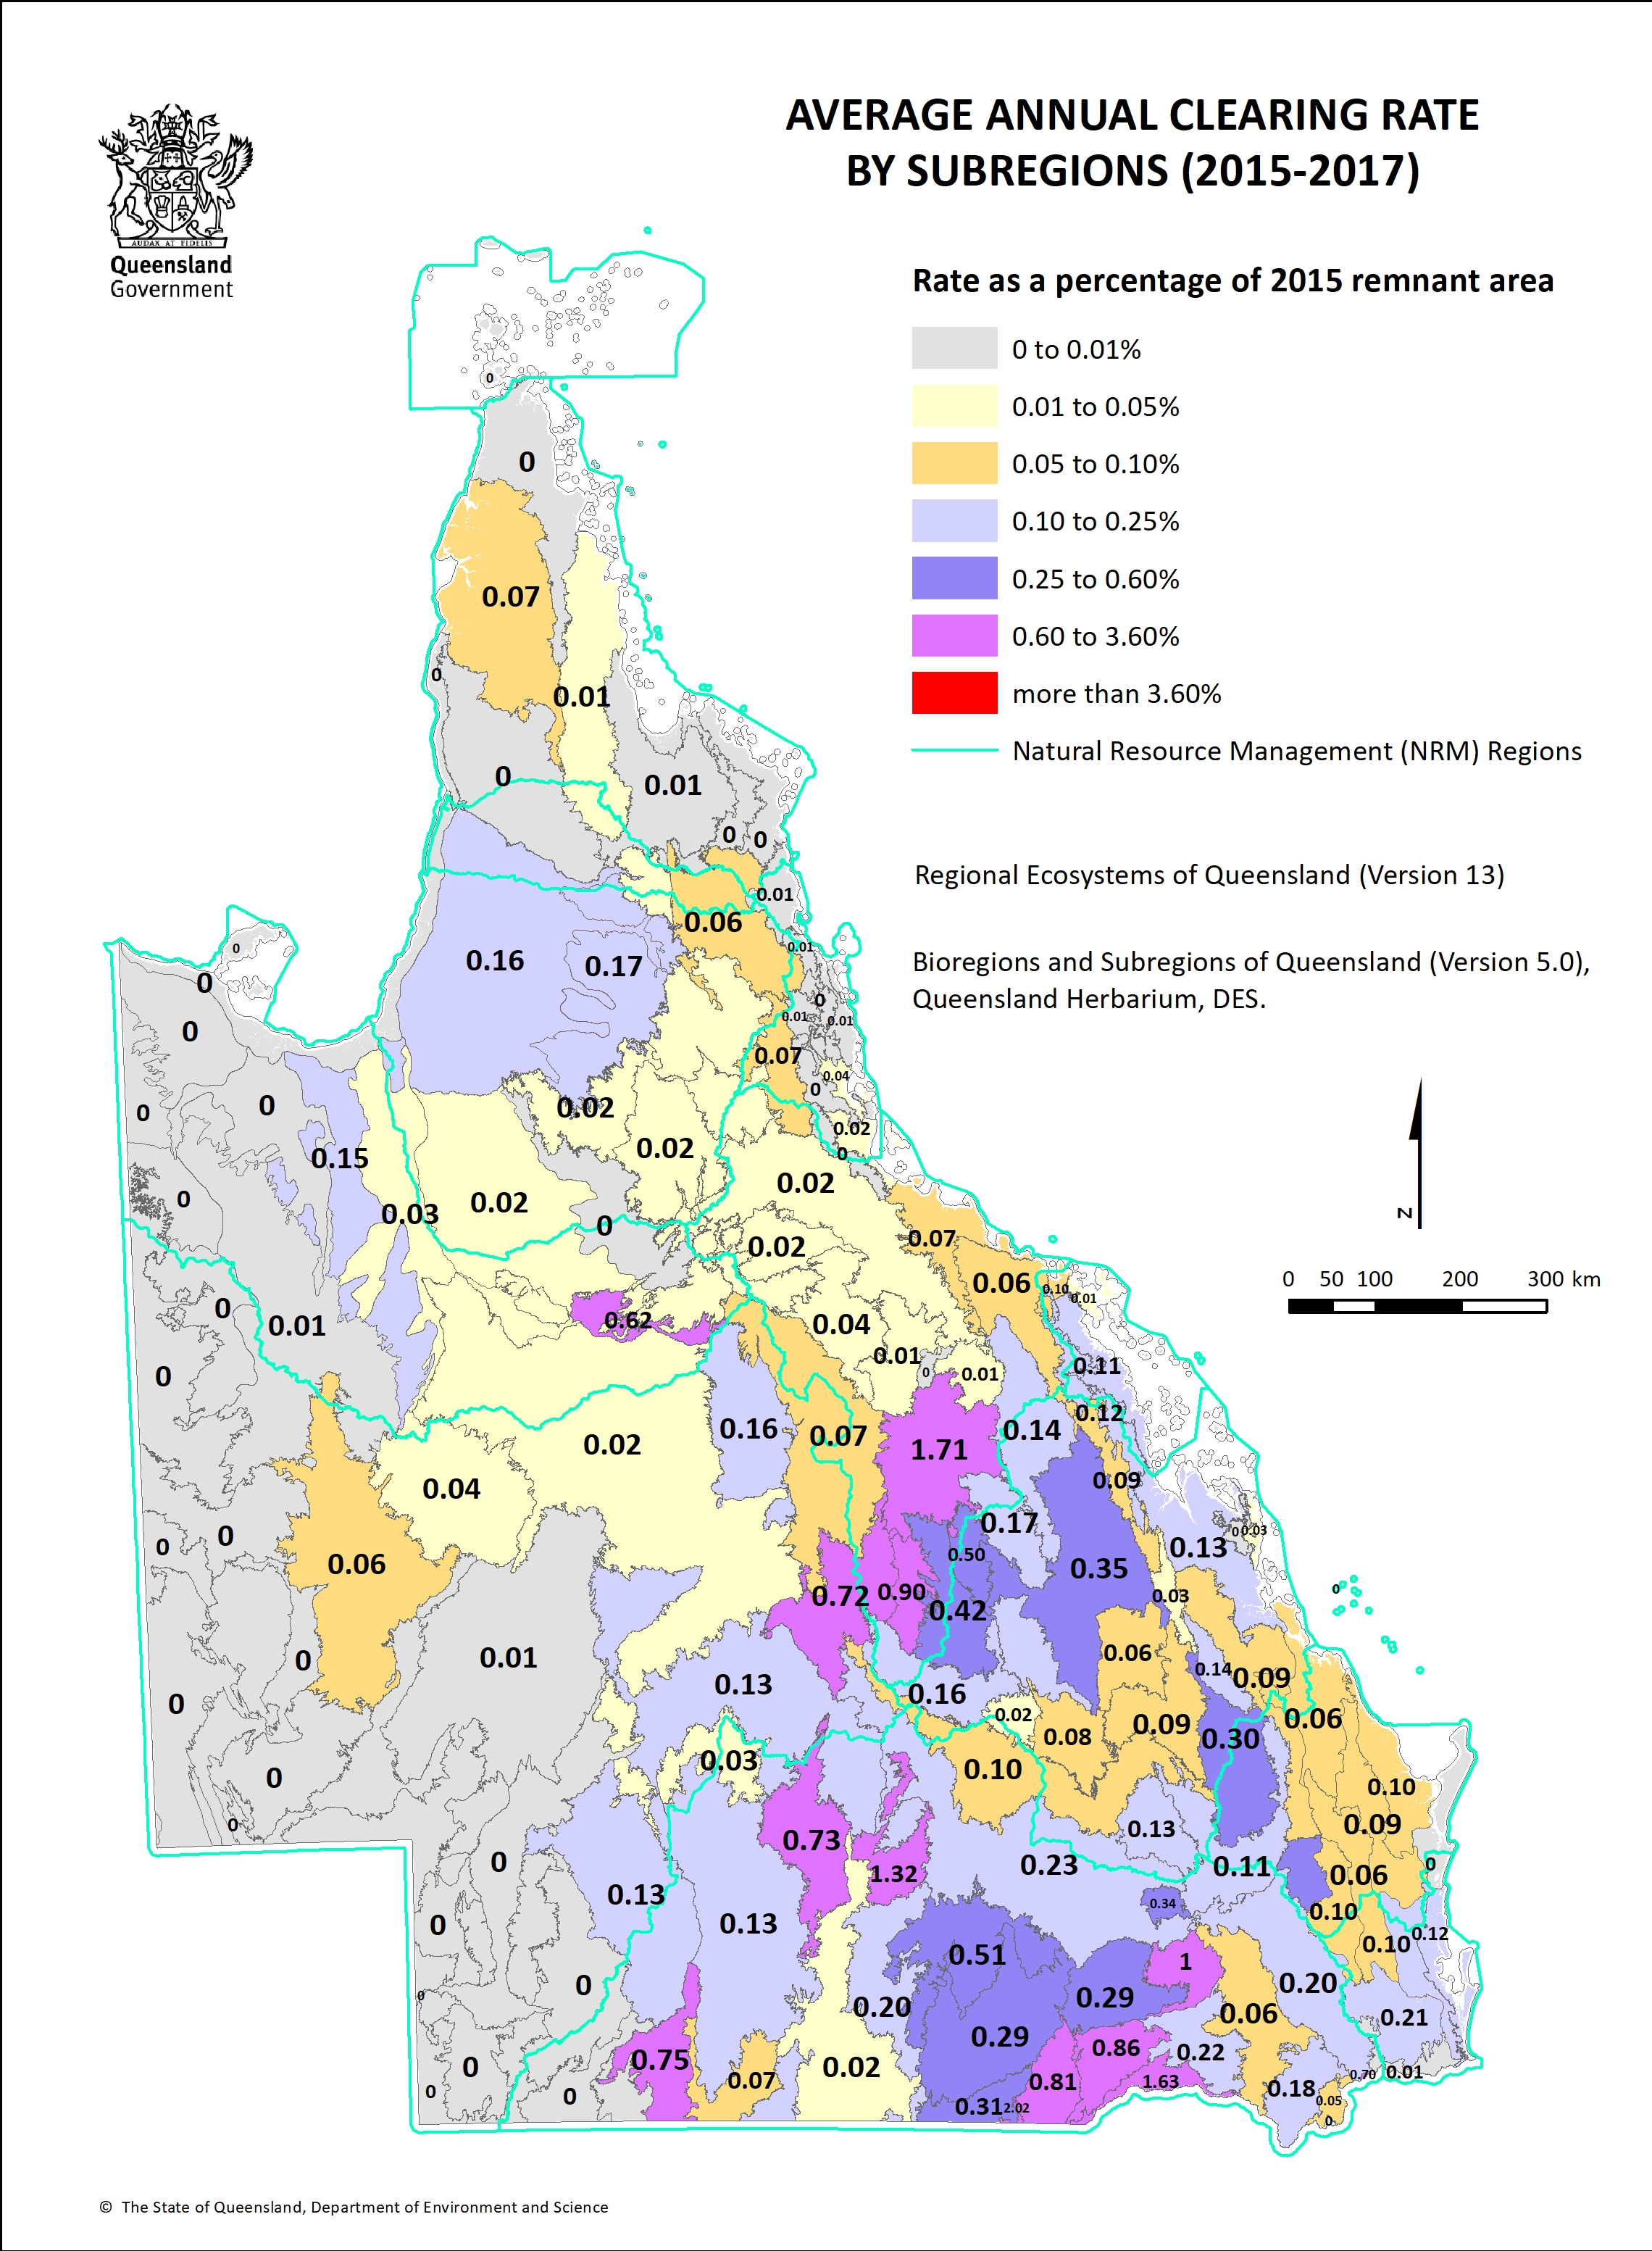
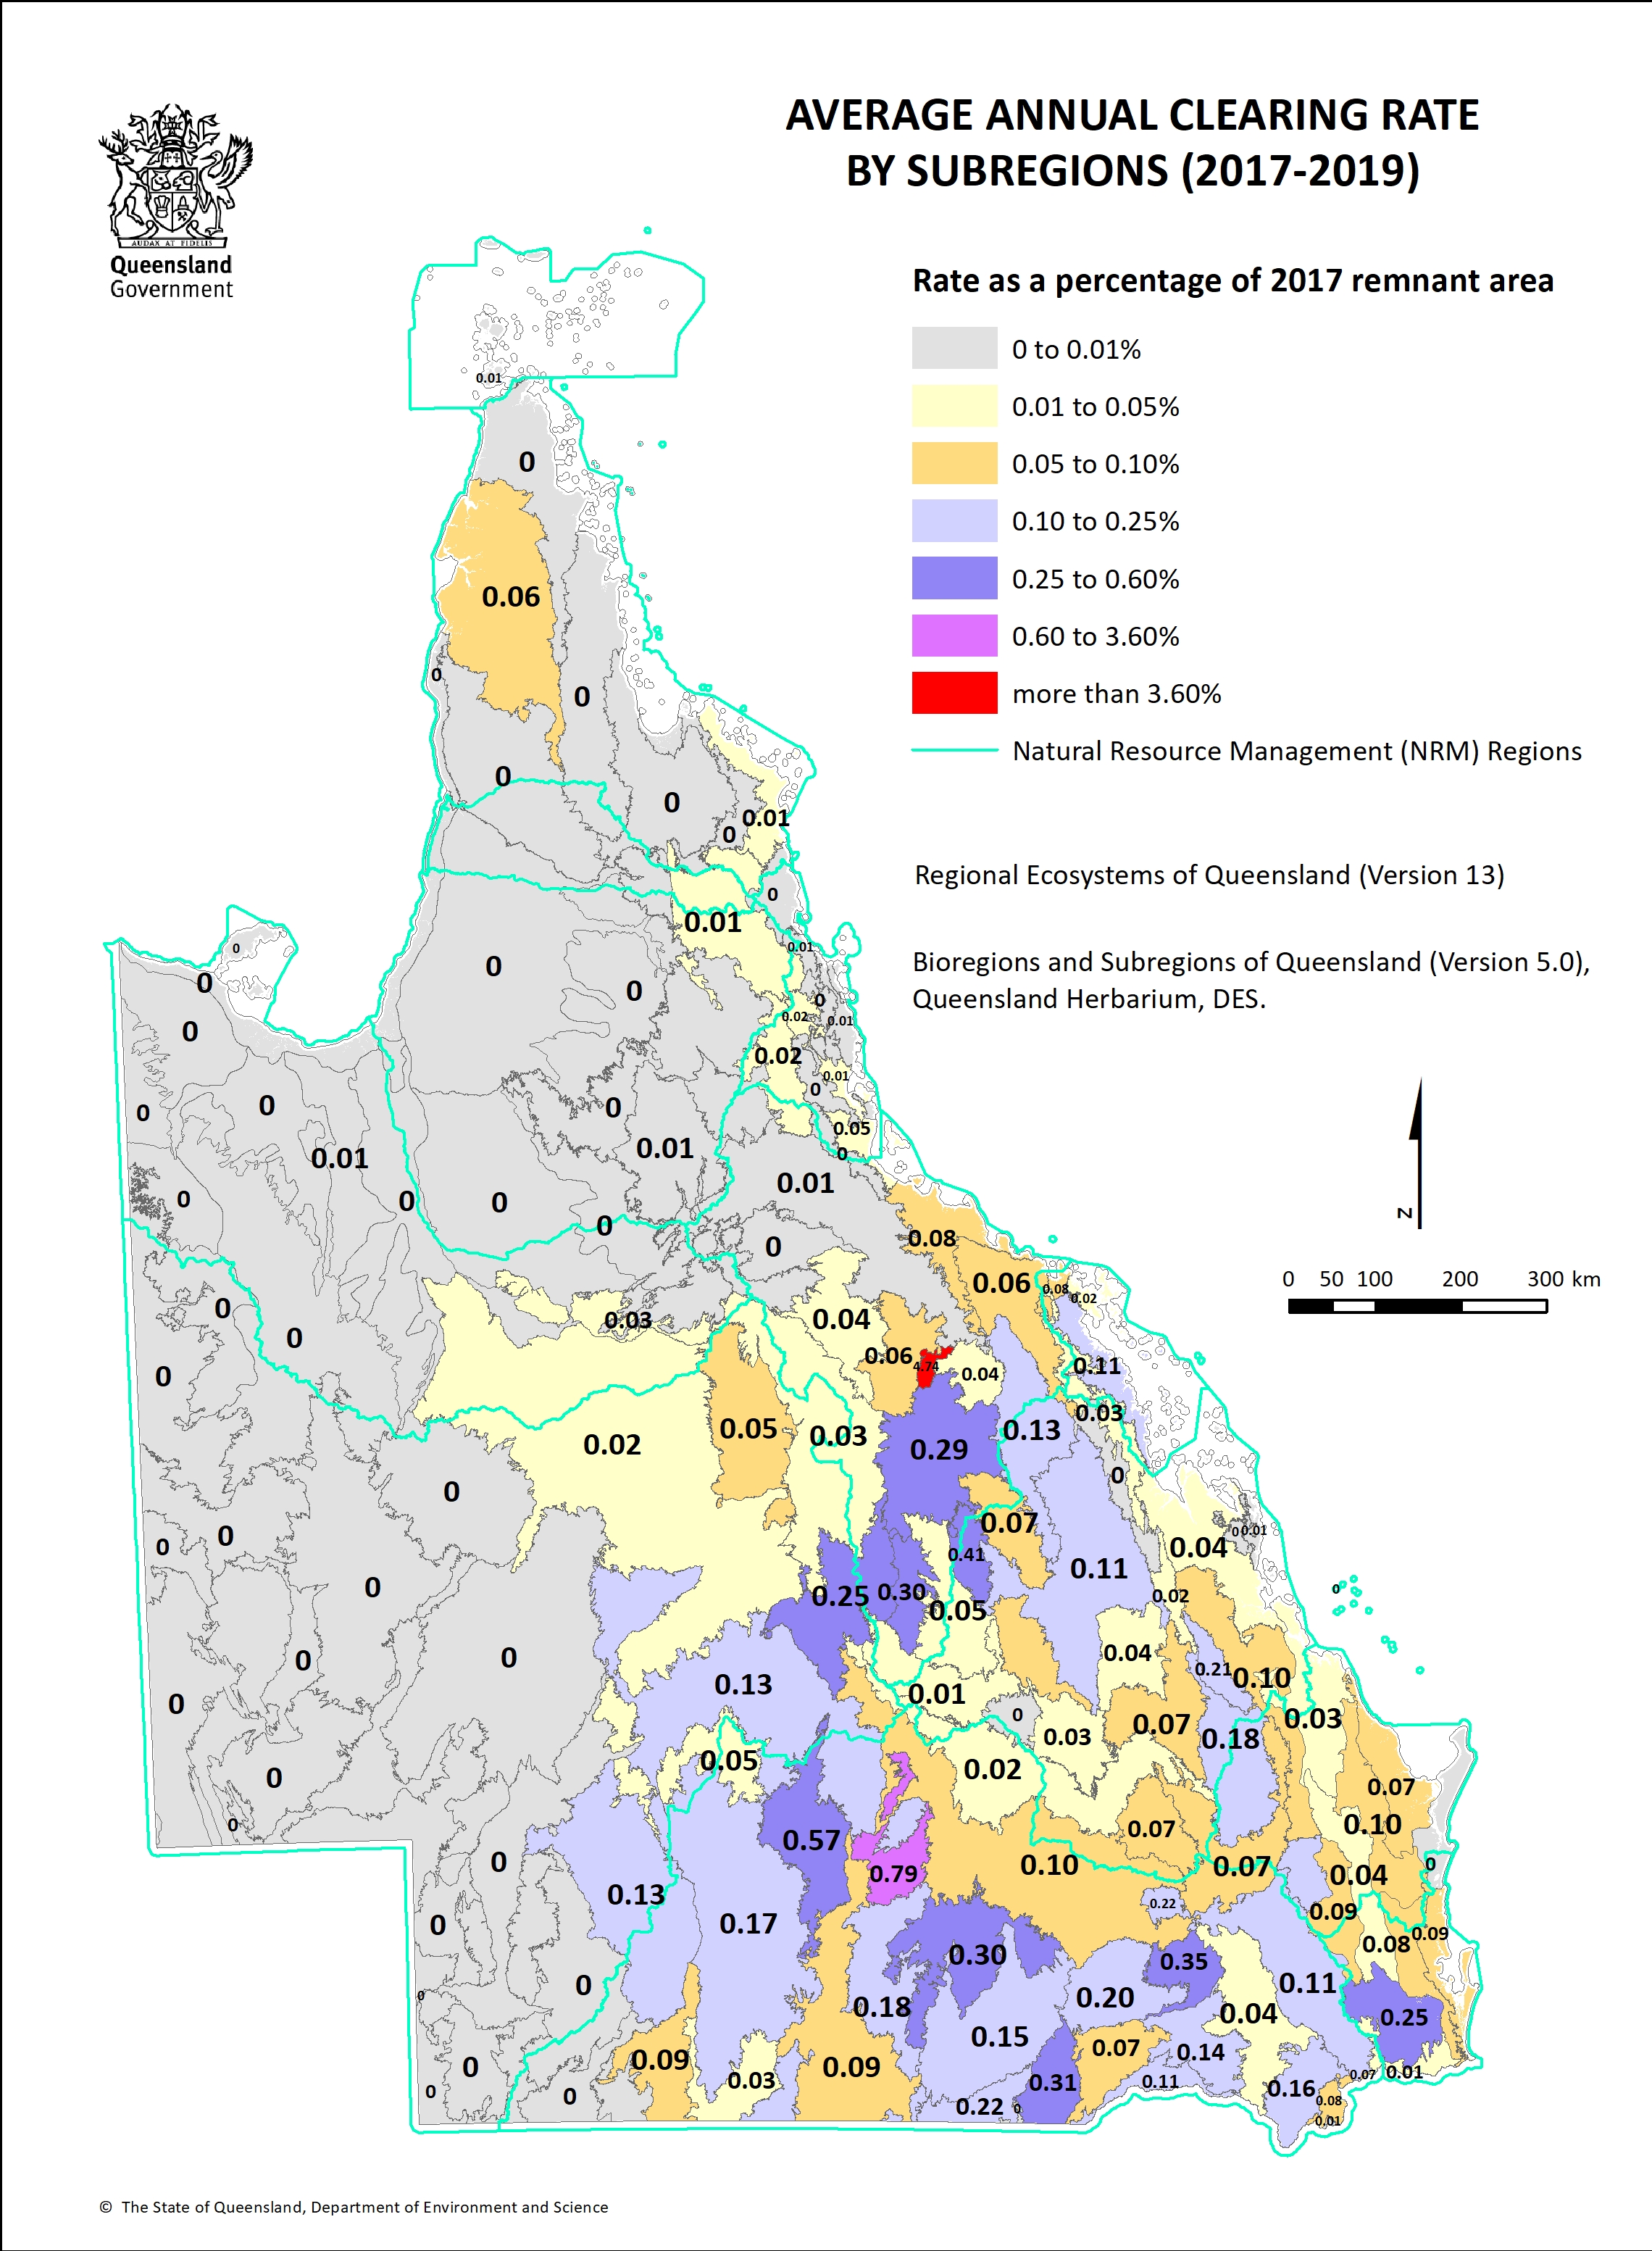
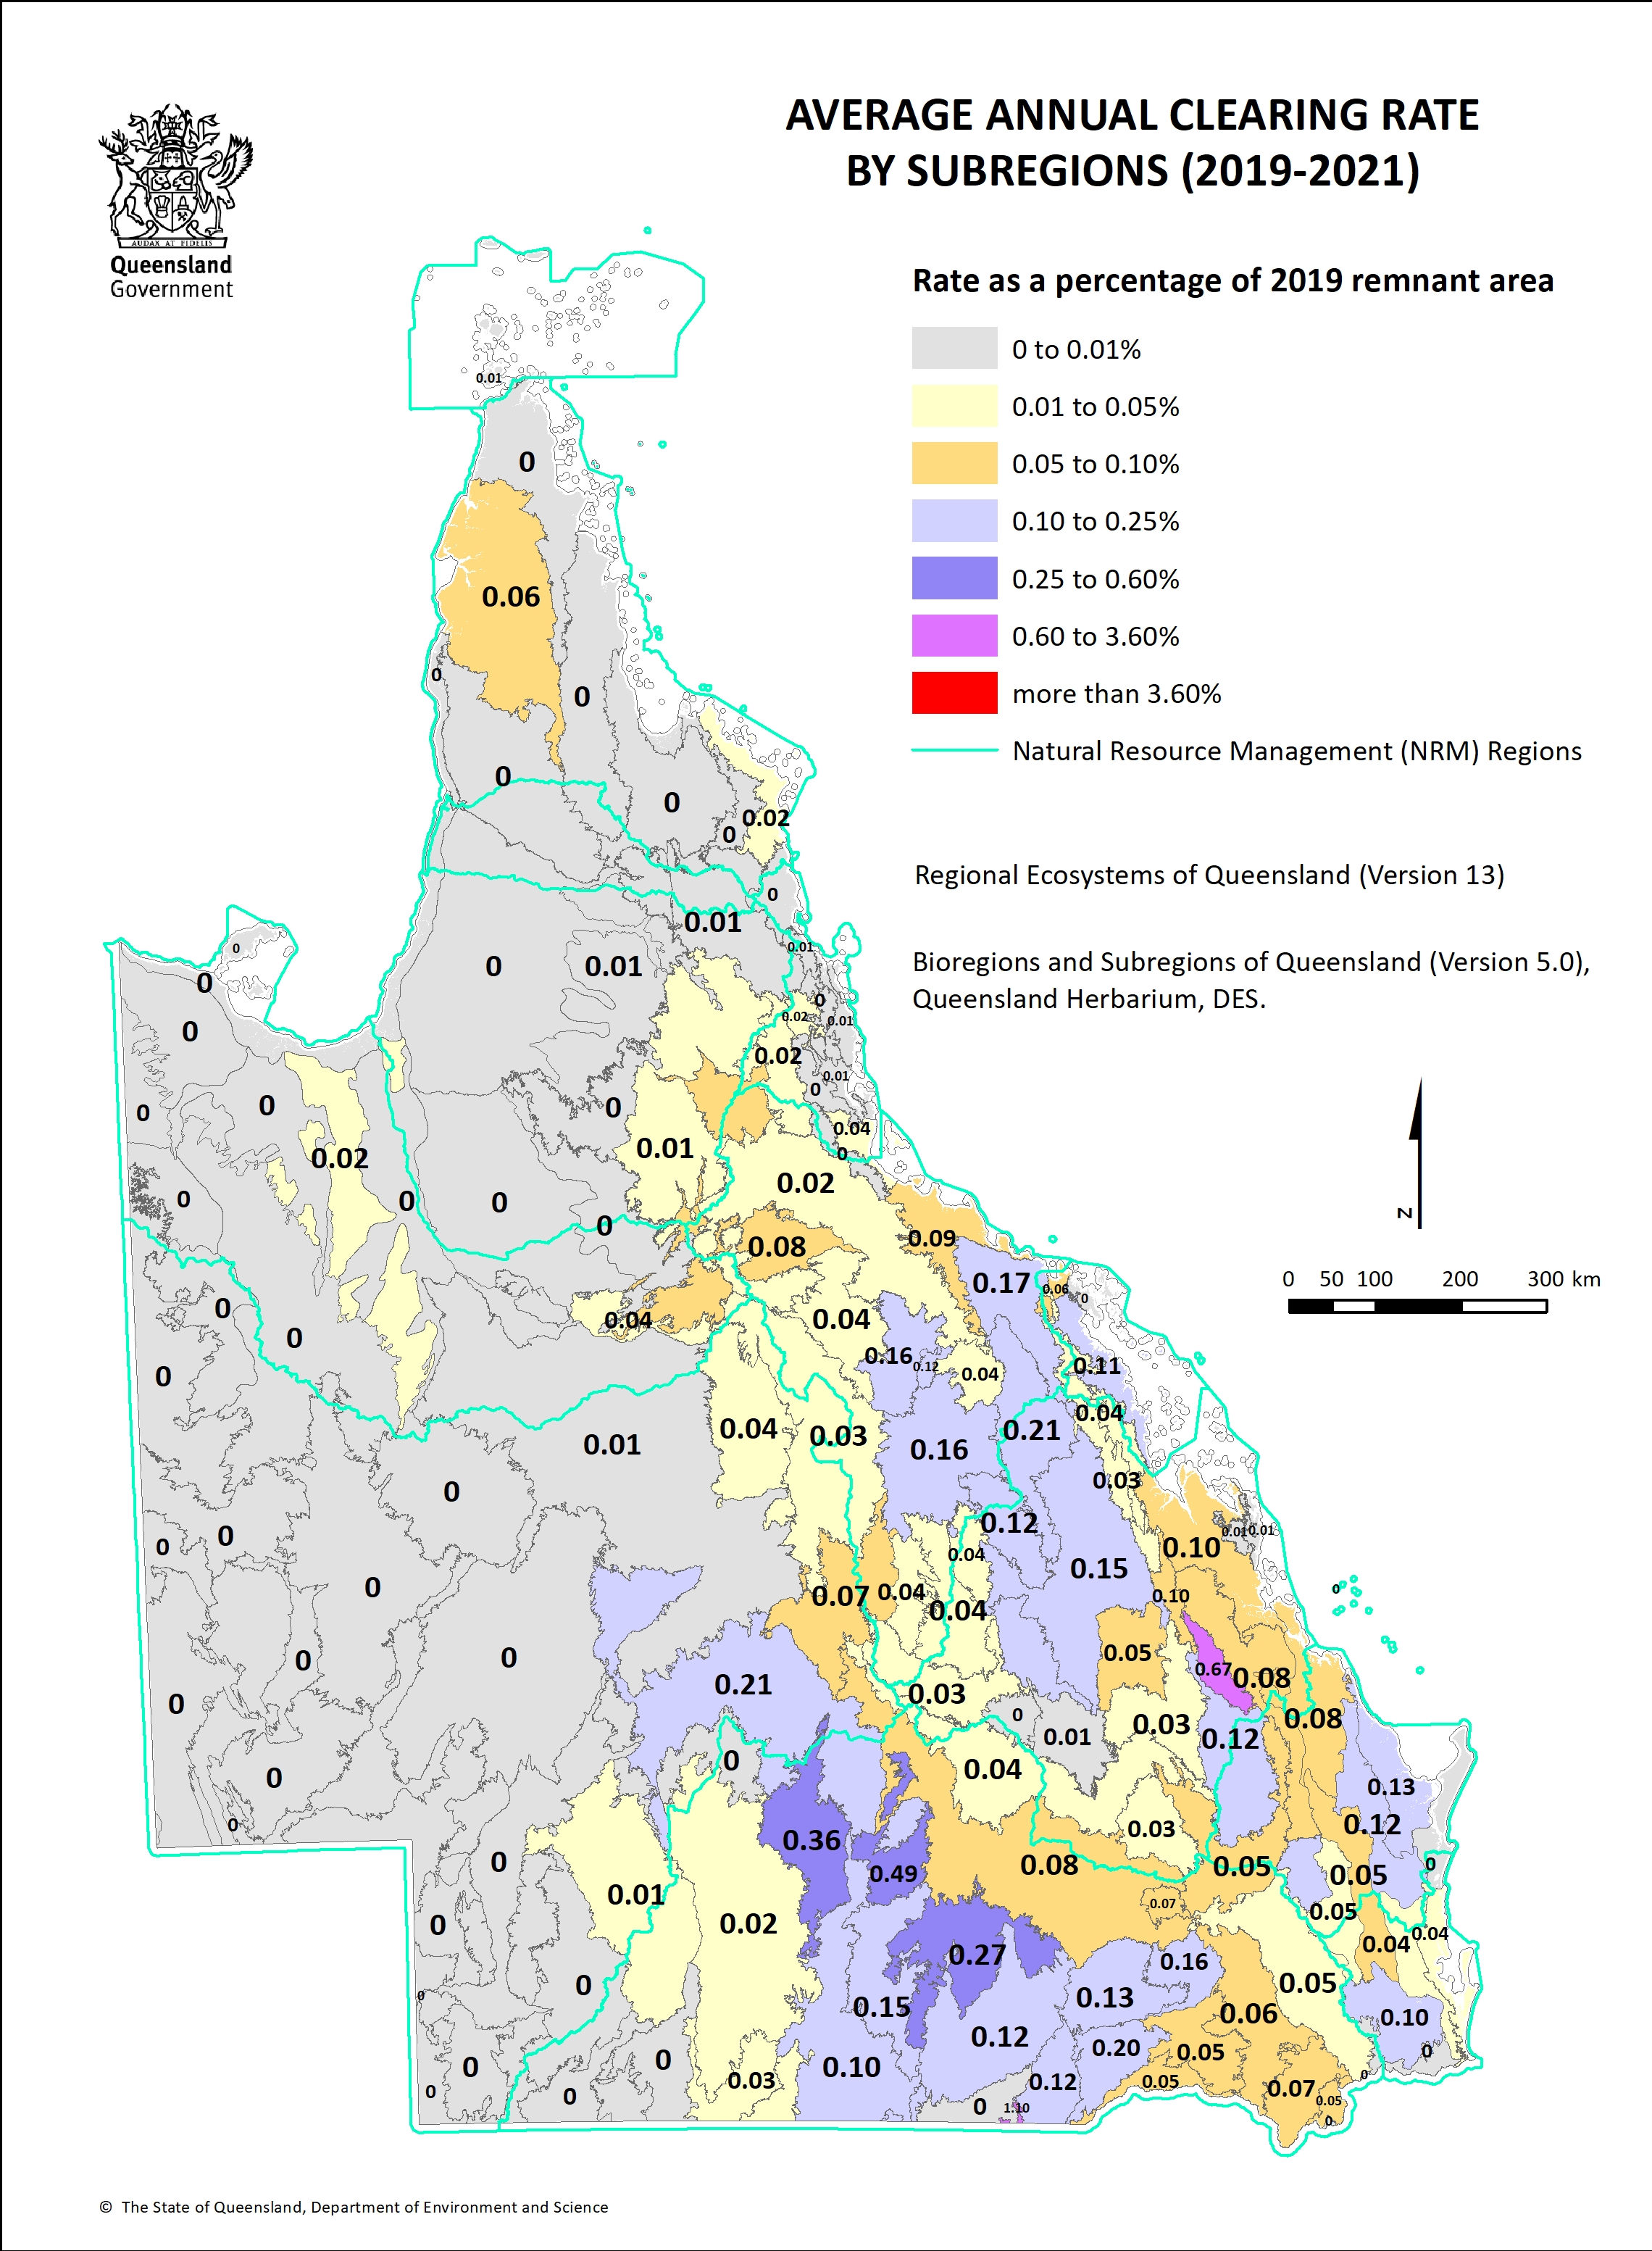
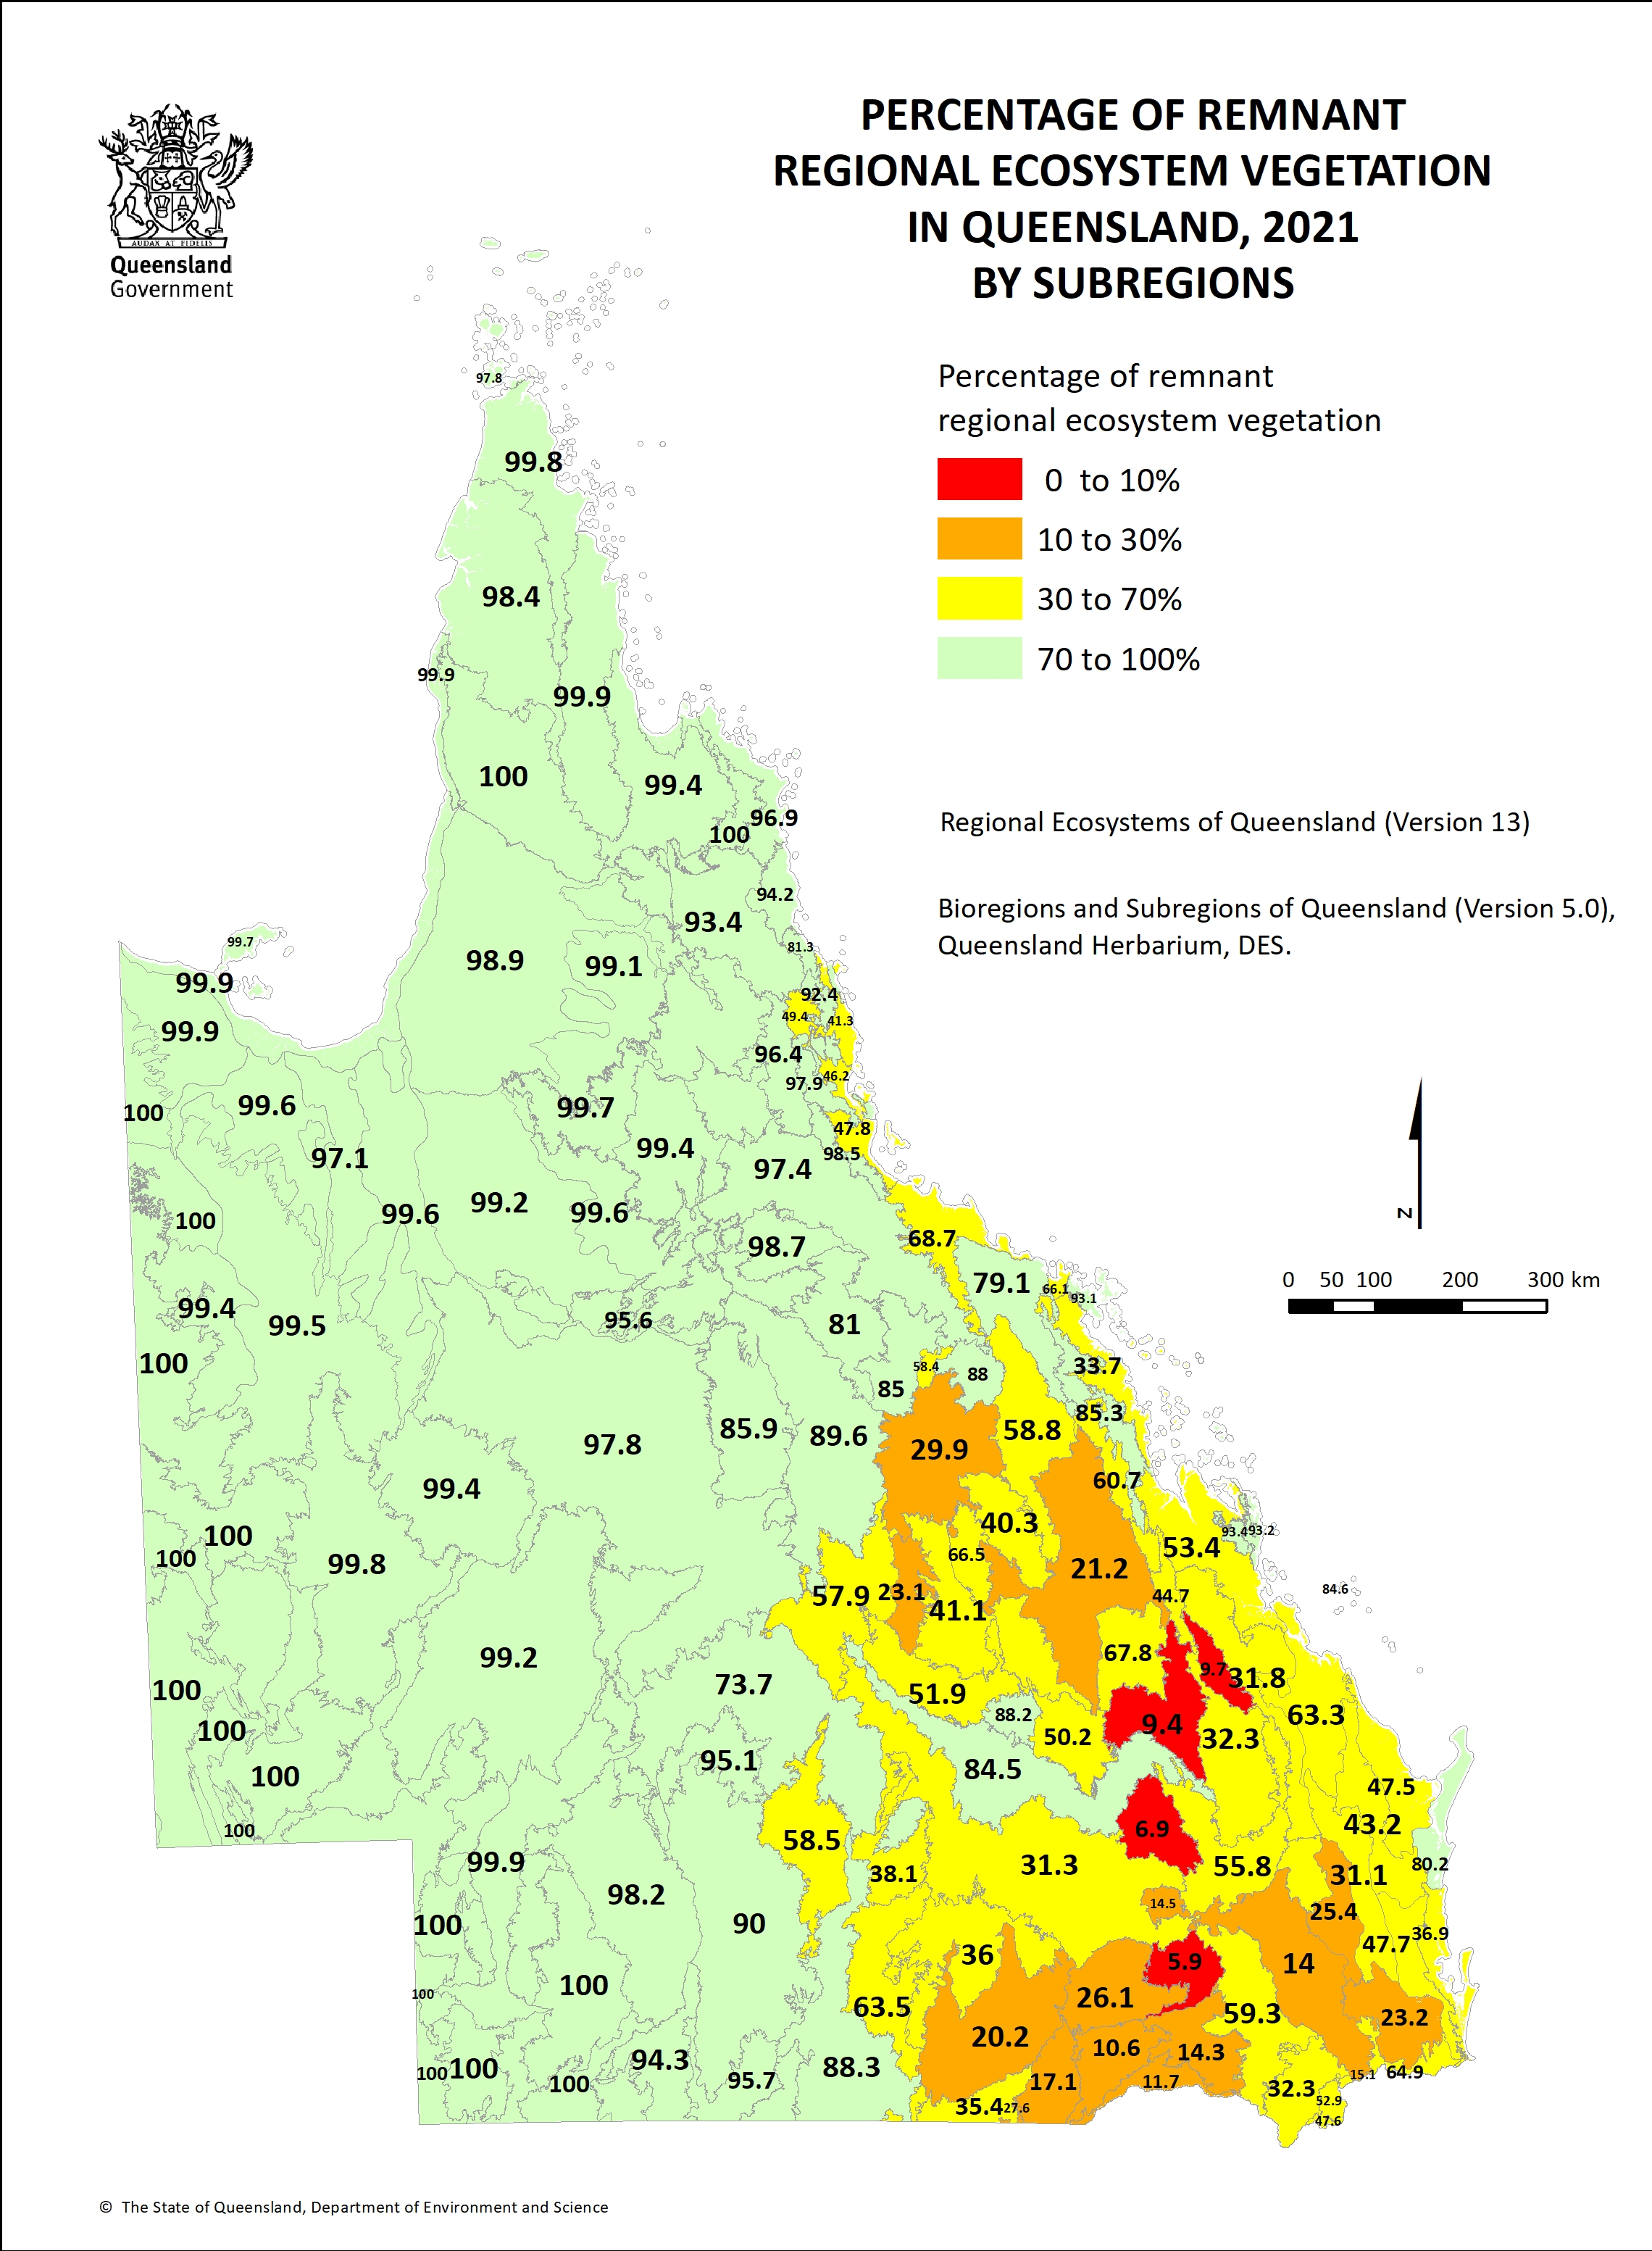
Subregion analysis of remnant vegetation by regional ecosystem vegetation communities between 1997 and 2021 showing the average annual clearing rate by subregion.

Tables and maps

  • Remnant cover by subregion (XLSX, 110.3 KB)
  • Regional ecosystems by subregion (XLSX, 6 MB)
  • Subregion clearing rate 1997-1999 (JPG, 1.9 MB)
  • Subregion clearing rate 1999-2000 (JPG, 1.9 MB)
  • Subregion clearing rate 2000-01 (JPG, 1.9 MB)
  • Subregion clearing rate 2001-03 (JPG, 1.9 MB)
  • Subregion clearing rate 2003-05 (JPG, 1.9 MB)
  • Subregion clearing rate 2005-06b (JPG, 1.9 MB)
  • Subregion clearing rate 2006b-09 (JPG, 1.9 MB)
  • Subregion clearing rate 2009-11 (JPG, 1.8 MB)
  • Subregion clearing rate 2011-13 (JPG, 1.8 MB)
  • Subregion clearing rate 2013-15 (JPG, 1.9 MB)
  • Subregion clearing rate 2015-17 (JPG, 1.9 MB)
  • Subregion clearing rate 2017-19 (JPG, 1.9 MB)
  • Subregion clearing rate 2019-21 (JPG, 1.9 MB)
  • Percentage of remnant vegetation by subregion (JPG, 1.8 MB)
  • Area analysed by subregion (JPG, 1.9 MB)
Last updated:
15 October 2024

Your browser is not supported. Some functionality might not work as expected.

Please upgrade your browser to a version on the supported browser list

Queensland Government

Contact us

Get in touch for enquiries, feedback, complaints and compliments.

Contact us
Phone: 13 QGOV (13 74 68)
/QueenslandGovernment
@QldGov
  • Help
  • Copyright
  • Disclaimer
  • Privacy
  • Right to information
  • Accessibility
  • Jobs in Queensland Government
  • Other languages

Website feedback

Help us improve the content on our website or tell us what is working well.

Leave your feedback
Loading...
Close

Cultural acknowledgement

We pay our respects to the Aboriginal and Torres Strait Islander ancestors of this land, their spirits and their legacy. The foundations laid by these ancestors—our First Nations peoples—give strength, inspiration and courage to current and future generations towards creating a better Queensland.

© The State of Queensland 1995 - 2025